

- Home
- >
- Opportunities for profit today
- >
- EUR/JPY: Short remains

EUR/JPY: Short remains
Rating:

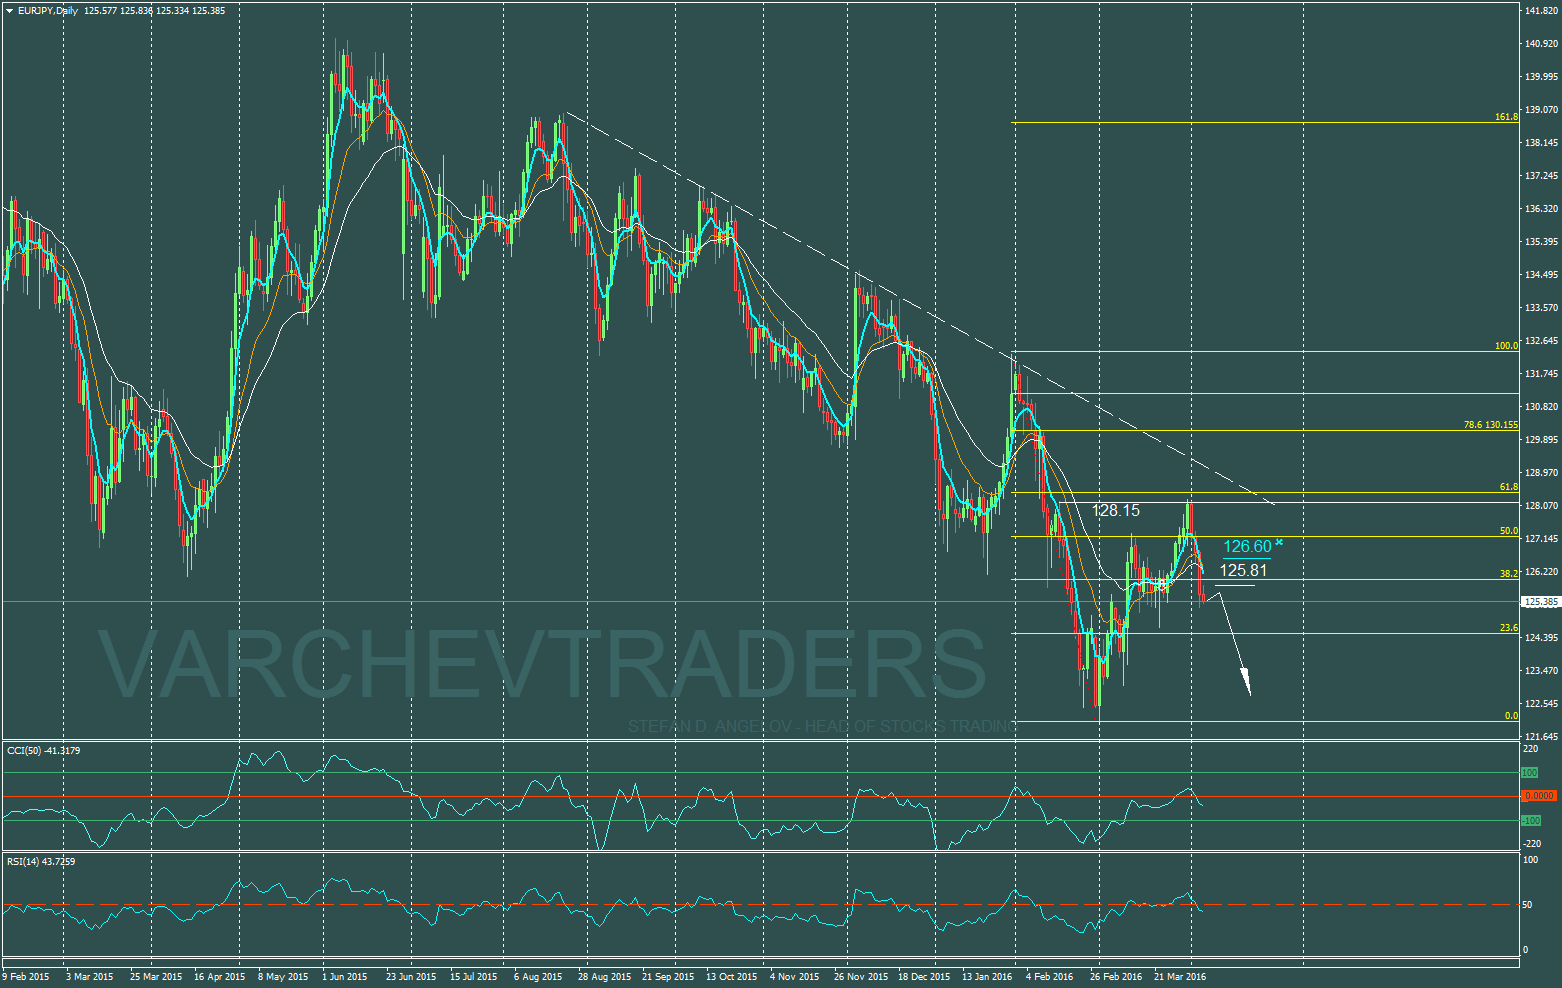
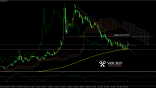
EUR/JPY: Daily Graph: Short Trend and small correction
FIBO 61.8% of the last short move - levels of resistance
Reversal bar on levels of resistance, almost the same as the previous bullish bar
price action: Forex bearish reversal candle pattern: Three inside Down - Negative Signal
Three Black Crowes-trend continuation formation
Price below diagonal resistance
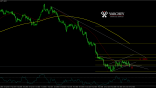
3 EMA moves below 13 and 25 ЕМА - in bearish formation
Indicators:
CCI(50) below 0 - negative signal
RSI moves below 50 - negative signal in bearish trend
Good place for sell after small correction on the 3rd bearish bar around 125.81
SL: 126.60
Stefan D. Angelov - Head of Stocks Trading
 Varchev Traders
 Read more:
RECCOMEND
WAS THIS POST USEFUL FOR YOU?
If you think, we can improve that section,
please comment. Your oppinion is imortant for us.
If you think, we can improve that section,
please comment. Your oppinion is imortant for us.

