

- Home
- >
- FX Daily Forecasts
- >
- EUR/NZD: Possible end of a correction and new short move

EUR/NZD: Possible end of a correction and new short move
Rating:

EUR/NZD:
Date: 19 December, 2016
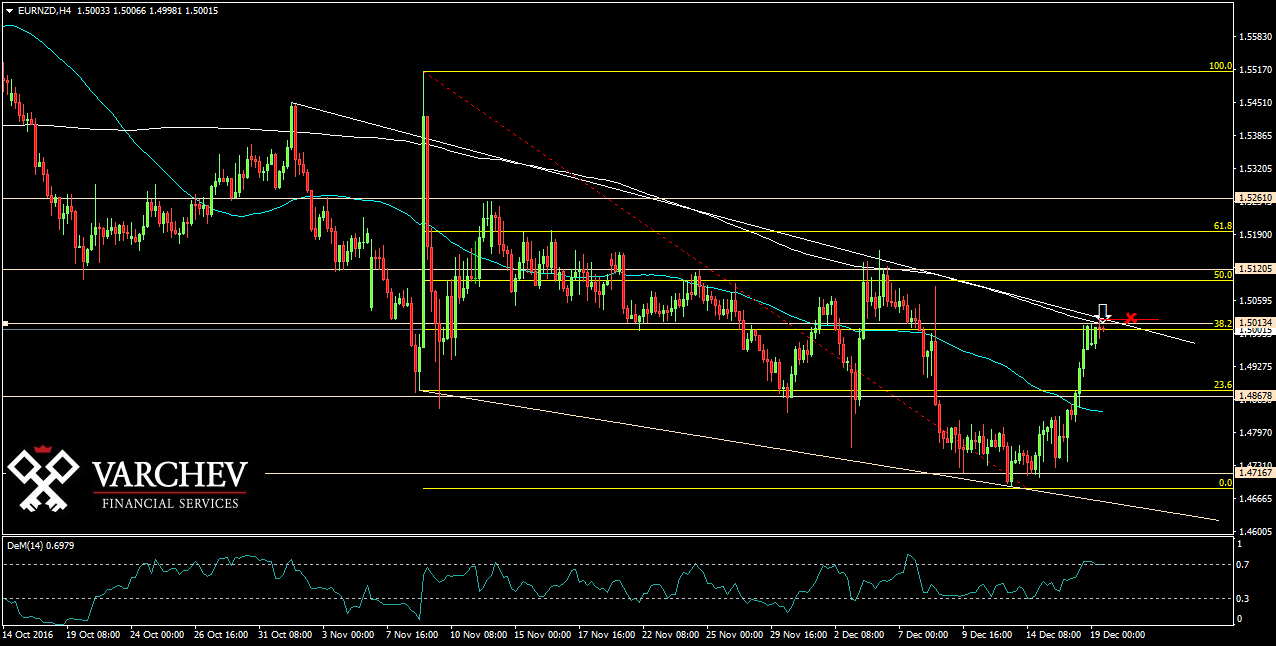
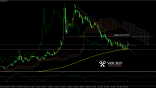
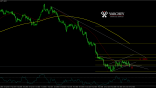
H4 Graph: Long term short
The price made a correction after it founded support at 1.47200, but it formed a bearish price channel. After the correction, price stopped its up move exactly at the top of the price channel, which corelateds which Fib level of 38,2%, and at 200 EAM. There is a horizontal and diagonal resistance.
Price Action: Doji bar at strong horizontal and diagonal resistance - possible signal for short.
DEM (14) - In the overbought zone and turned down for short.
Alternative scenario: If the price moves up above the doji bar high and above the diagonal resistance , will cancel the bearish scenario.
Price for Entry short around: 1.50100
SL: 1.50700
Jr. Trader - S. Fuchedzhiev
 Varchev Traders
 Read more:
RECCOMEND
WAS THIS POST USEFUL FOR YOU?
If you think, we can improve that section,
please comment. Your oppinion is imortant for us.
If you think, we can improve that section,
please comment. Your oppinion is imortant for us.

