

- Home
- >
- FX Daily Forecasts
- >
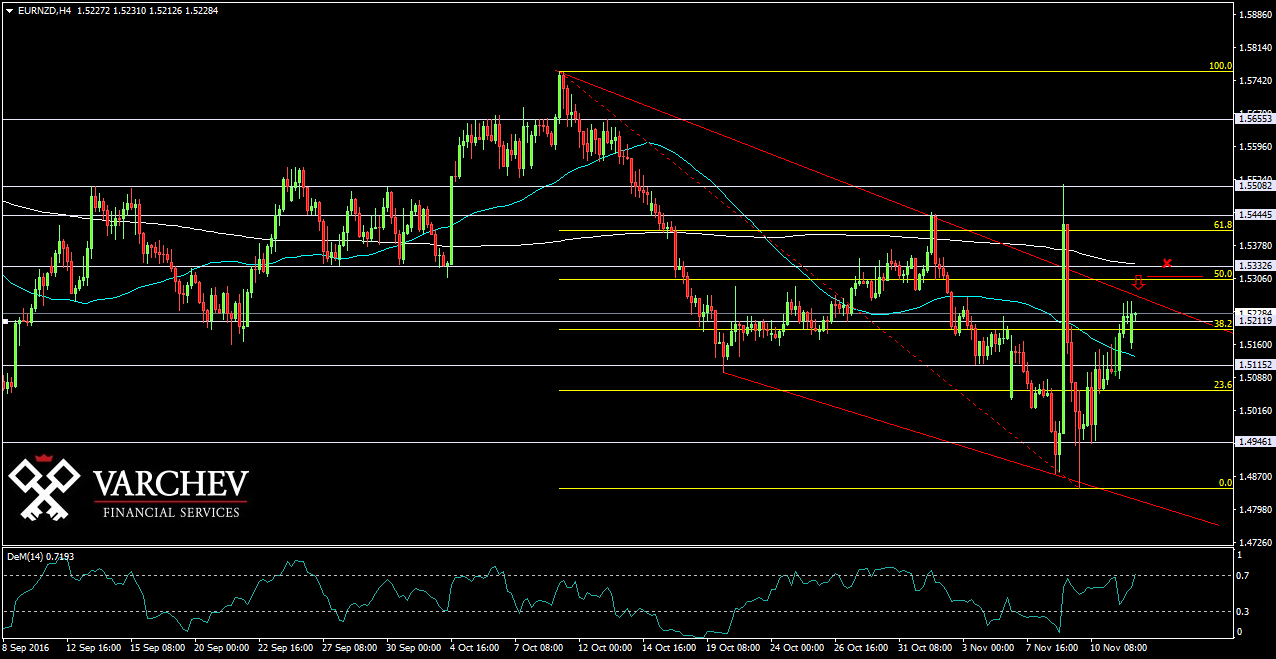
- EUR/NZD: Possible end of the correction, close to diagonal and horizontal resistance

EUR/NZD: Possible end of the correction, close to diagonal and horizontal resistance
Rating:

EUR/NZD:
Date: 14 November, 2016
H4 Graph: Medium term short trend
The price made a correction upward, but the price stopped raising exactly on a horizontal resistance at 1,52200 and just below the diagonal resistance. Fibo level 38,2% also coincides in the same zone. Price continue to remain below the 200 ЕМА, which is a dynamic resistance.
Price Action: Doji bar at levels of horizontal and diagonal resistance - Possible short signal.

Alternative scenario: If the price moves up and passes above the diagonal resistance, this will cance the bearish scenario.
Technical Indicator:
DEM (14) - It just entering the overbought zone
Price for Entry short around: 1,5220
SL: 1.53300
Jr. Trader - S. Fuchedzhiev
 Varchev Traders
RECCOMEND
WAS THIS POST USEFUL FOR YOU?
If you think, we can improve that section,
please comment. Your oppinion is imortant for us.
If you think, we can improve that section,
please comment. Your oppinion is imortant for us.

