

- Home
- >
- FX Daily Forecasts
- >
- EURUSD 2019 expectations – technical, fundamentals and statistics

EURUSD 2019 expectations - technical, fundamentals and statistics
Rating:

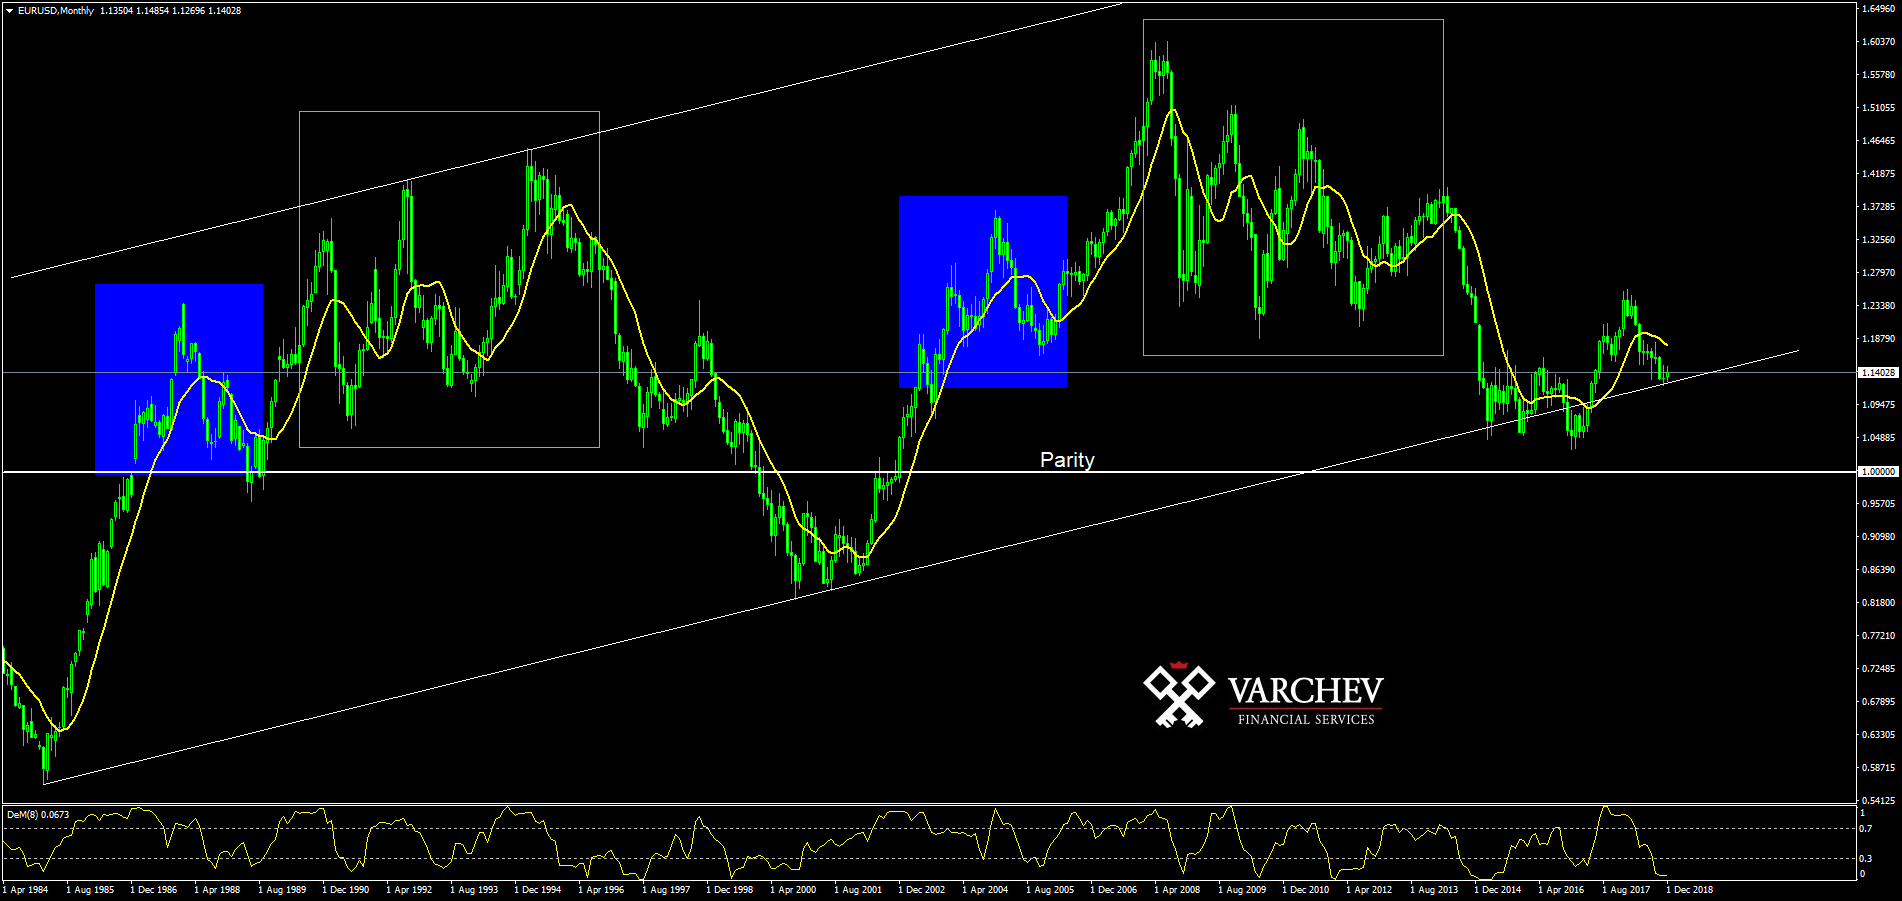
We focus on the most traded forex pair the EURUSD and the likely scenario in 2019. The price is above the long-term diagonal support from the bottoms of 1985, 2001 and 2016 on Monthly chart /MN1/. DeM (14) is in a heavily oversold zone below 0.3 but there is still no confirmation of turning the indicator north. Negative for the pair is the fact that the price is currently below the 12MA moving average, which given 12 months of the year can serve as a good milestone for the monthly expectations.

The 61.8 Fibonacci level of the last upward movement holds at least for now and the price fails to break below 50 periodic moving average.
Technically, while the price stays above these levels of serious support, we can look for long positions in the pair, as those positions must be long term with larger SL.
Alternative scenario: Breakthrough under the diagonal support and Fibo level can trigger a serious downward impulse to even parity in the pair.
Fundamentals: Currently, the main thing that moves all markets is, of course, US President Donald Trump and the trade war with China. The strong dollar, in turn, has led to a fall in stock markets, which is not generally the favorite situation for Trump,as even rumors came out about a potential dismissal of Fed Chairman Jerome Powell.
The tightening of the Fed's monetary policy has long been a fact, and this is more likely to be priced in the dollar strength. At the other pole after the last ECB meeting and the suspension of the QE program, traders are likely to start accumulating the likely change in monetary policy direction of the European Central Bank. This should rather send the pair to positive territory in early 2019, with the pair statistically performing better in the early part of each year for the period 1981-2018.
The risks of a weak euro, of course, remain Brexit, the financial instability of Italy and the protests in France, while the USD risk is the likely change in monetary policy tightening by the Fed, which was implied by the reduction in the expectation of 3 to 2 increases interest rates in 2019.
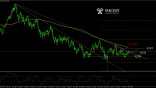
Considering the short-term consolidation of 270-300 pips in the daily chart in the pair, we can remain cautious and wait for a confirmed breakout in one of the two directions before a long term positioning.
From a statistical point of view, the pair's volatility has dropped and is even close to its record low:

This gives reason to expect an increase in instability at EURUSD in early 2019, with the next impulse in the pair likely going to be quite sharp and consistent, but as we said earlier, it is rational to wait for a breakthrough of the consolidation.

Looking at the net change for the pair in pips, we will notice serious changes in 2007-2008, preceded precisely by a drop in volatility previously. In other words, the likelihood of big movements in the pair during 2019 is rising.

From the chart above we can say that January and May are statistically the strongest for EUR, and September and December strongest for the USD.
Many analysts are of the opinion that the only thing that can save the stock markets is the cheaper dollar. This, in turn, should lead to a rise in oil and other commodities, which would restore investors' confidence in risky assets. This scenario, however, is not to be underestimated, and we can expect a strong EUR appreciation at the beginning of 2019, lasting at least until September, and by the end of 2019 one of the most anticipated levels for the pair remains 1.08 - 1.09.
Charts and data: Varchev Meta Trader 4 Essential Edition
 Trader Nikolay Georgiev
 Read more:
 AUDUSD: key levels where we are looking for short positions
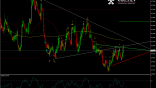 AUDUSD bounces off the resistance zone despite the positivism during the Asian hours
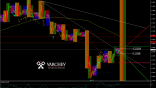 EURUSD in a tight range during the Asian session
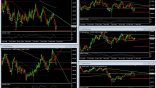 EUR in a recovery mode, but vulnerable | Technical levels
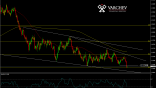 EURUSD continues ranging in the early EU session. NFP data in focus at 15:30
If you think, we can improve that section,
please comment. Your oppinion is imortant for us.

