

- Home
- >
- FX Daily Forecasts
- >
- EUR/USD more probable to keep moving downward

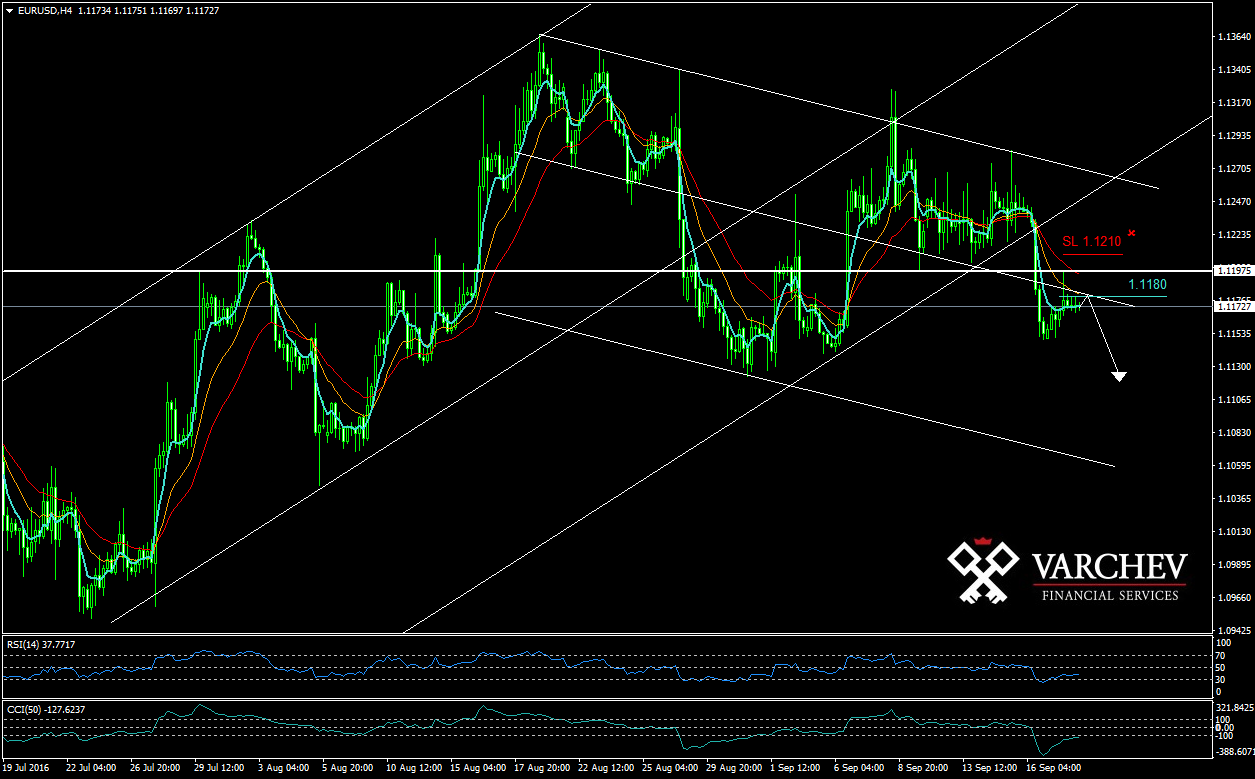
EUR/USD more probable to keep moving downward
Rating:

EUR/USD 20.09.2016 H4 chart:

Long term downtrend and mid term consolidation.
Short term movement is more likely to stay short.
Price below diagonal and horizontal resistances.
Price action: pin bar at levels of resistance for probable downward impulse
Technical indicators:
Price below dynamic moving averages EMA 5,13,25, ordered in bearish formation - negative signal
CCI(50) - below -100 and RSI(14) - below 50 - negative territory for probable downward impulse
Entry: after correction to 1.1180 to minimize risk or now
SL: 1.1210
Alternative scenario: If price breaks above the upper shadow of the pin bar this will cancel the negative scenario.
Jr. Trader Nikolay Georgiev
 Varchev Traders
RECCOMEND
WAS THIS POST USEFUL FOR YOU?
If you think, we can improve that section,
please comment. Your oppinion is imortant for us.
If you think, we can improve that section,
please comment. Your oppinion is imortant for us.

