

- Home
- >
- FX Daily Forecasts
- >
- EUR/USD: movement remains short. Opportunities for short positions after correction

EUR/USD: movement remains short. Opportunities for short positions after correction
Rating:

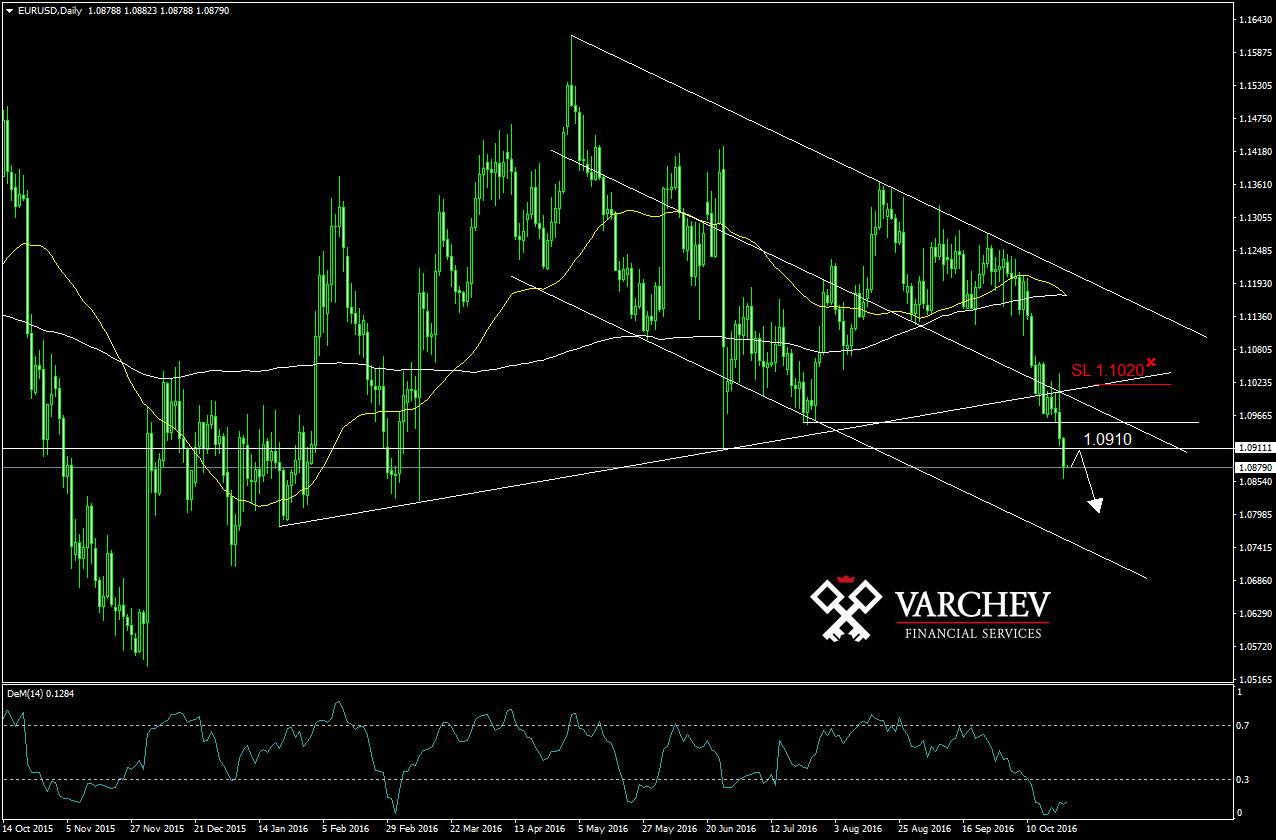
EUR/USD 24.10.2016 D1 chart.
Long-term downward trend and mid-term choppy
Breakthrough below key level 1,0910
It is possible to have a slight correction between 20 and 40 pips while two equal candles are formed at 4H chart but the possible movement remains short.
Price below resistances - diagonal and horizontal
Technical indicator:
Possible deadly crossing at SMA50 and SMA200 upwards - signal for a possible sudden decline
SL: 1.1020
Alternative scenario: If the price goes above the resistances, this will break the negative scenario.
Jr. Trader Nikolay Georgiev
RECCOMEND
WAS THIS POST USEFUL FOR YOU?
If you think, we can improve that section,
please comment. Your oppinion is imortant for us.
If you think, we can improve that section,
please comment. Your oppinion is imortant for us.

