

- Home
- >
- FX Daily Forecasts
- >
- EUR/USD negative sentiment remains. New short after a correction

EUR/USD negative sentiment remains. New short after a correction
Rating:

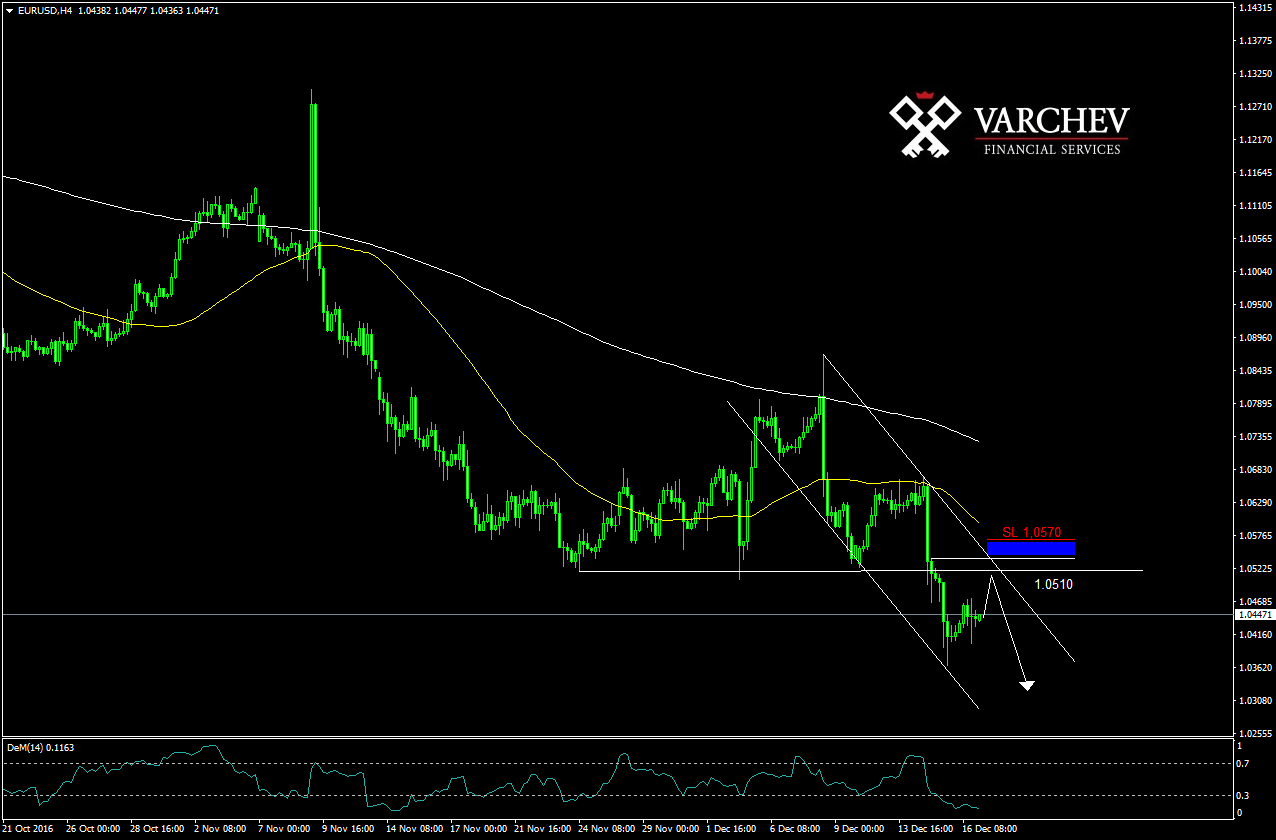
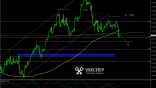
EUR/USD 19.12.2016 H4 chart.
Long term downtrend and short term downward movement.
Break below the neckline of a Head and Shoulders formation, in this case trend confirming formation.
Price below resistances - diagonal and horizontal.
Technical indicators:
Price below SMA50 and SMA200 in a bearish formation - sell
DeM(14) in oversold zone below 0,3 - increased likelihood for a little correction
We should wait a correction around 1.0510 to minimize risk.
SL 1.0570
Alternative scenario: Break above the resistances will cancel the negative formation and price will likely go and test the shoulder of the H&S around levels 1,0665.
Jr. Trader Nikolay Georgiev
 Varchev Traders
 Read more:

RECCOMEND
WAS THIS POST USEFUL FOR YOU?
If you think, we can improve that section,
please comment. Your oppinion is imortant for us.
If you think, we can improve that section,
please comment. Your oppinion is imortant for us.

