

- Home
- >
- FX Daily Forecasts
- >
- EUR/USD possibility for new short positions after a little correction

EUR/USD possibility for new short positions after a little correction
Rating:

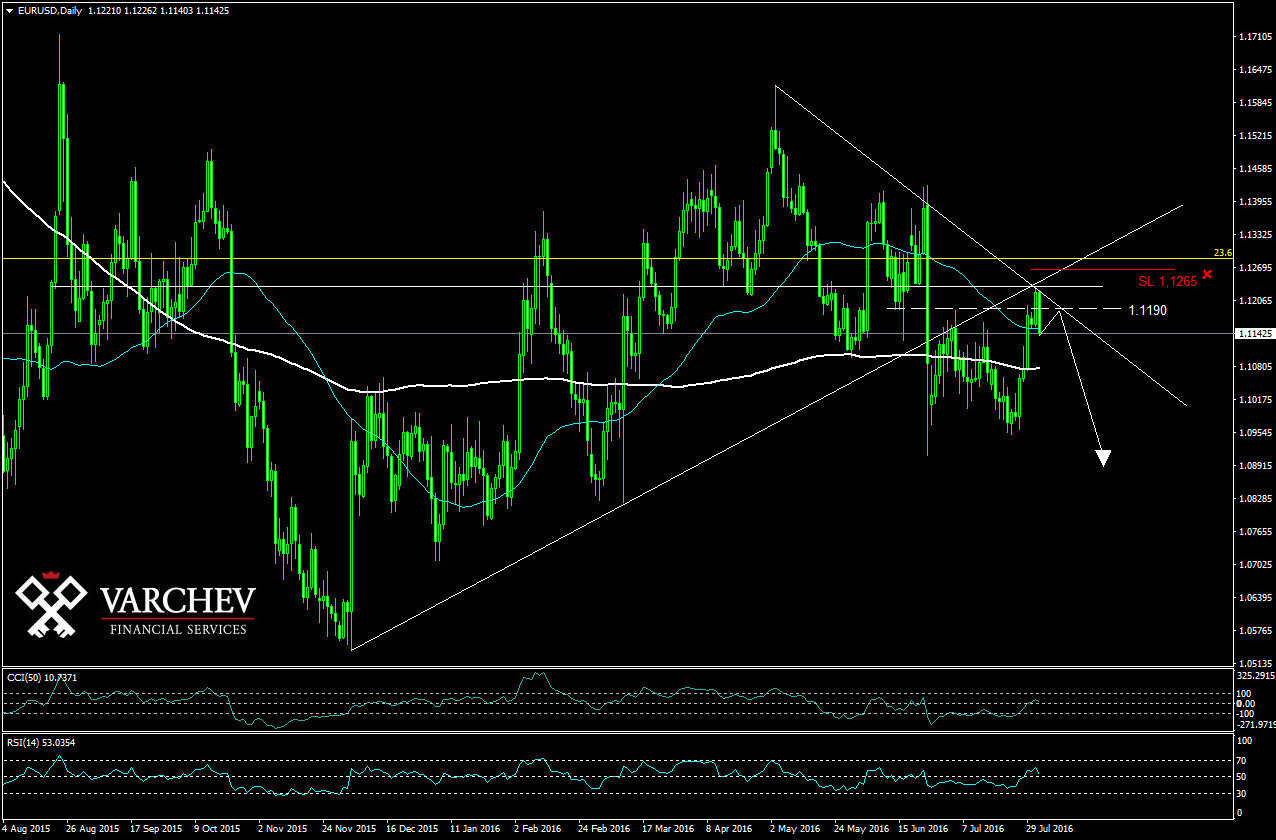
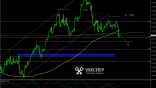
EUR/USD 03.08.2016 D1 chart.
Long-term downtrend and short-term choppy.
Price is below 23,6 Fibonacci of the long-term downtrend.
Price below horizontal and diagonal resistances
Price action: Bearish engulfing at levels of resistance, but the bar is still current.
Technical indicators:
RSI(14) is still above 50, but indicators are a step behind the price action: if this cross under 50 will be a sell confirming signal.
CCI(50) is above 0, as break under 0 will be a confirming sell signal.
Entry: After correction to 1,1119, which is probable since price now is on weak support.
SL: 1.1265
Alternative scenario: If price goes above the resistances this will negate the bearish scenario.
Jr. Trader Nikolay Georgiev
 Varchev Traders
 Read more:

RECCOMEND
WAS THIS POST USEFUL FOR YOU?
If you think, we can improve that section,
please comment. Your oppinion is imortant for us.
If you think, we can improve that section,
please comment. Your oppinion is imortant for us.

