

- Home
- >
- FX Daily Forecasts
- >
- EUR/USD: probability for a new downward movement

EUR/USD: probability for a new downward movement
Rating:

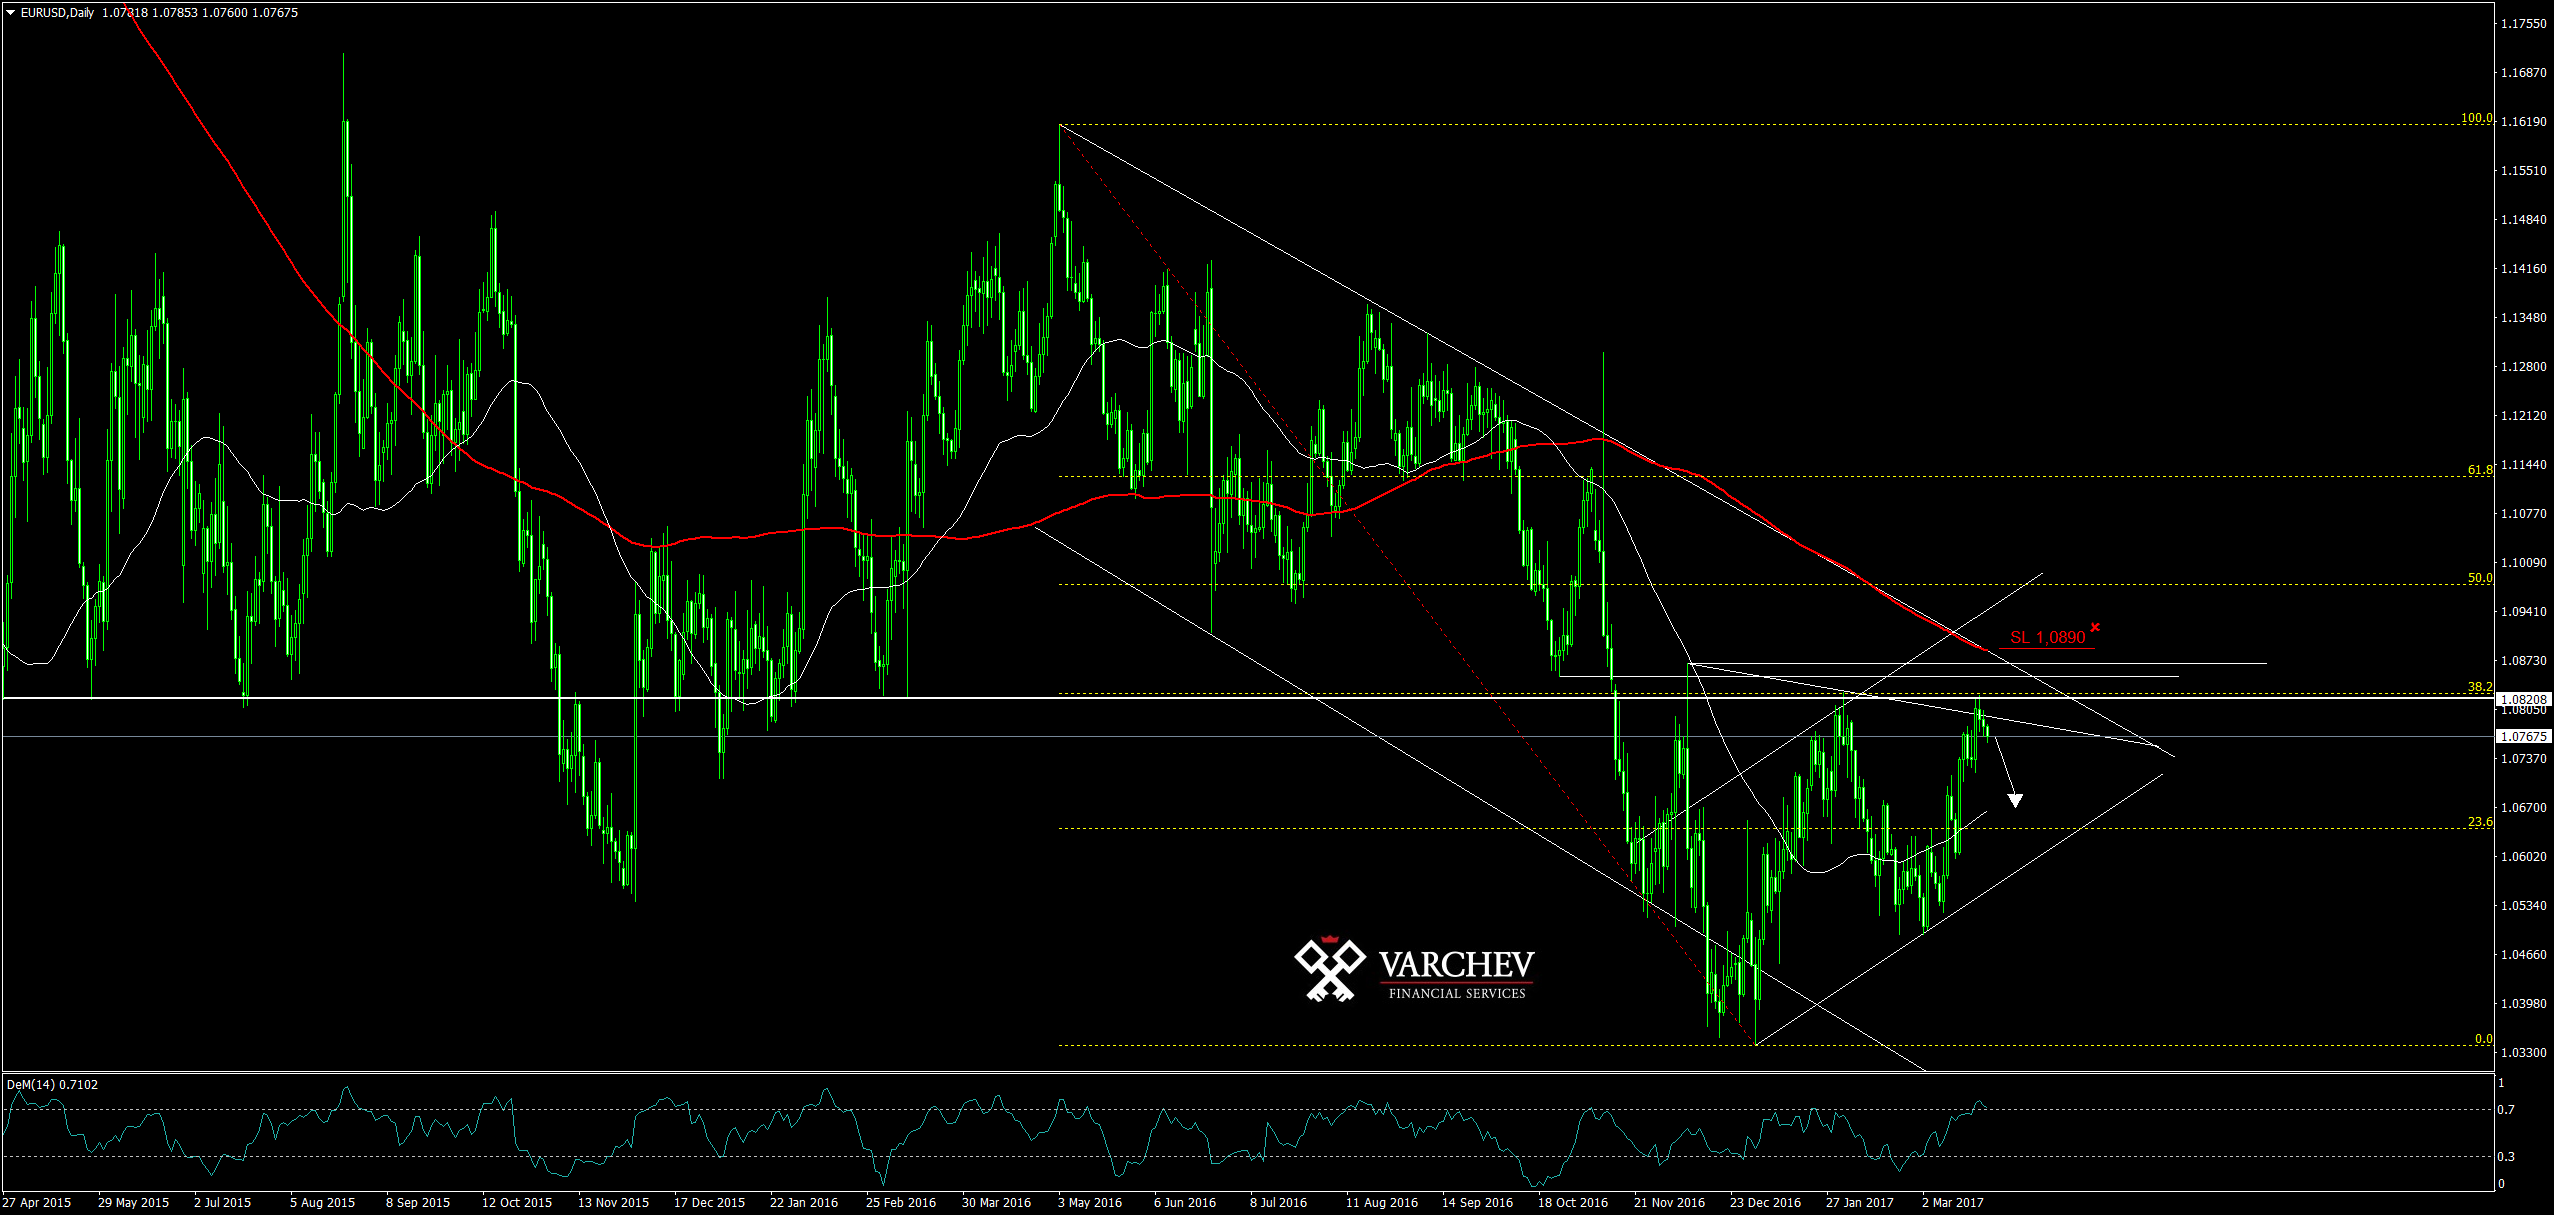
EUR/USD: 24.03.2017 D1 Chart
Declining trend and short term choppy.
Price under 38.2 Fibonacci of the last movement.
Triangle formated, as the price is in the upper side of the declining trend - possibility to sell.
Price is under key horizontal support - negative signal.
Three lower tops and lower bottoms - the negative tendency is likely to continue.
Indicators:
DeM(14) turns in oversold market above 0.7 - confirming the possible turn of the last corrective movement.
SL: 1.0890
Alternative scenario: Breach and maintaining levels (at least 3 bars) above the resistances will deny this movement.
Trader Nikolay Georgiev
 Varchev Traders
 Read more:


RECCOMEND
WAS THIS POST USEFUL FOR YOU?
If you think, we can improve that section,
please comment. Your oppinion is imortant for us.
If you think, we can improve that section,
please comment. Your oppinion is imortant for us.

