

- Home
- >
- FX Daily Forecasts
- >
- EUR/USD probable new downward impulse

EUR/USD probable new downward impulse
Rating:

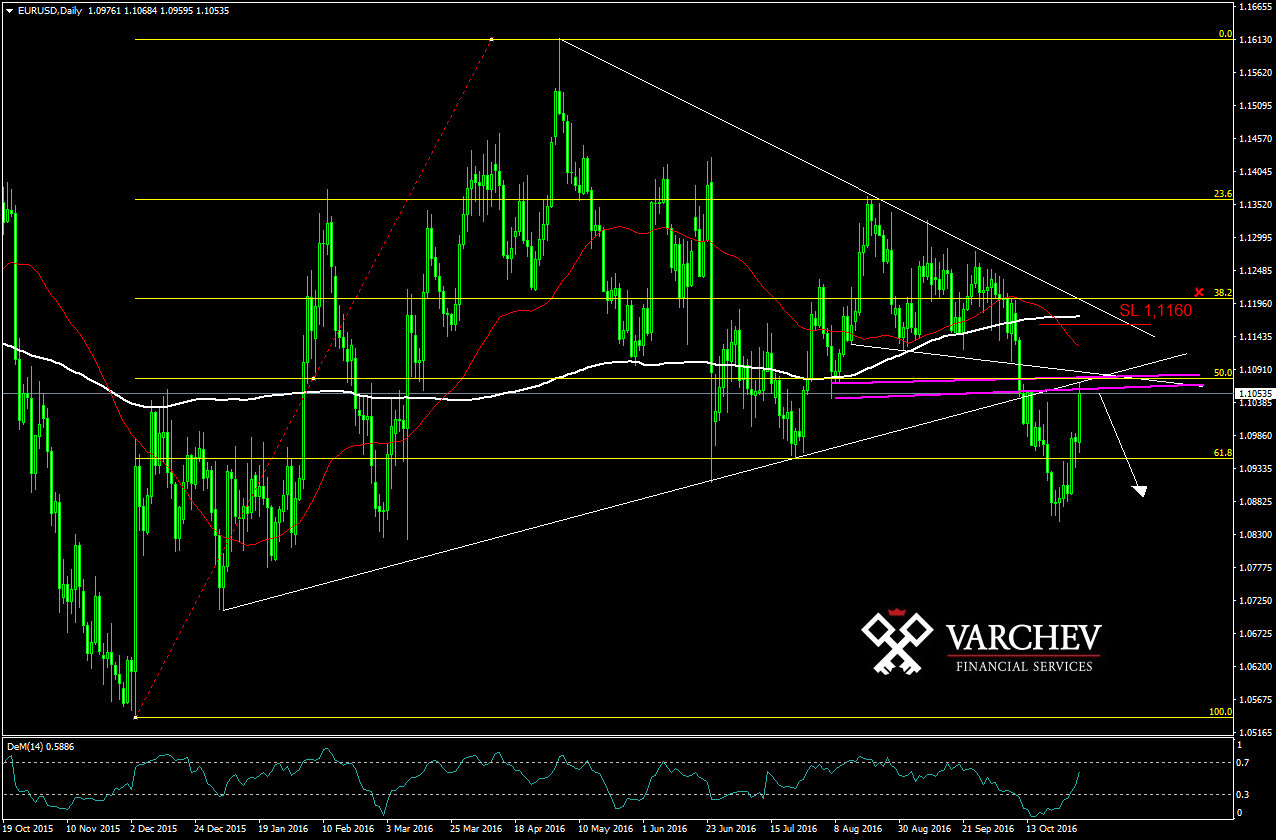
EUR/USD 01.10.2016 D1 chart.
Long term downtrend, mide term choppy, short term downward movement and correction.
Price is testing a break below diagonal support, which is current resistance and below 50% Fibonacci of the last upward movement.
Price is below zone of horizontal resistance.
Technical indicators:
SMA50 crossed SMA200 - death crossing - probable downward impulse
SL 1,1160

Pin bar on H1 chart and bearish engulfing bar aftwrward for probable downward movement.
Alternative scenario: If price breaks and stays above the zone of hroizontal resistance this will cancel the negative scenario.
Jr. Trader Nikolay Georgiev
 Varchev Traders
RECCOMEND
WAS THIS POST USEFUL FOR YOU?
If you think, we can improve that section,
please comment. Your oppinion is imortant for us.
If you think, we can improve that section,
please comment. Your oppinion is imortant for us.

