

- Home
- >
- FX Daily Forecasts
- >
- EUR/USD: Strong level of support. Possible new long

EUR/USD: Strong level of support. Possible new long
Rating:

EUR/USD:
Date: August 8, 2016
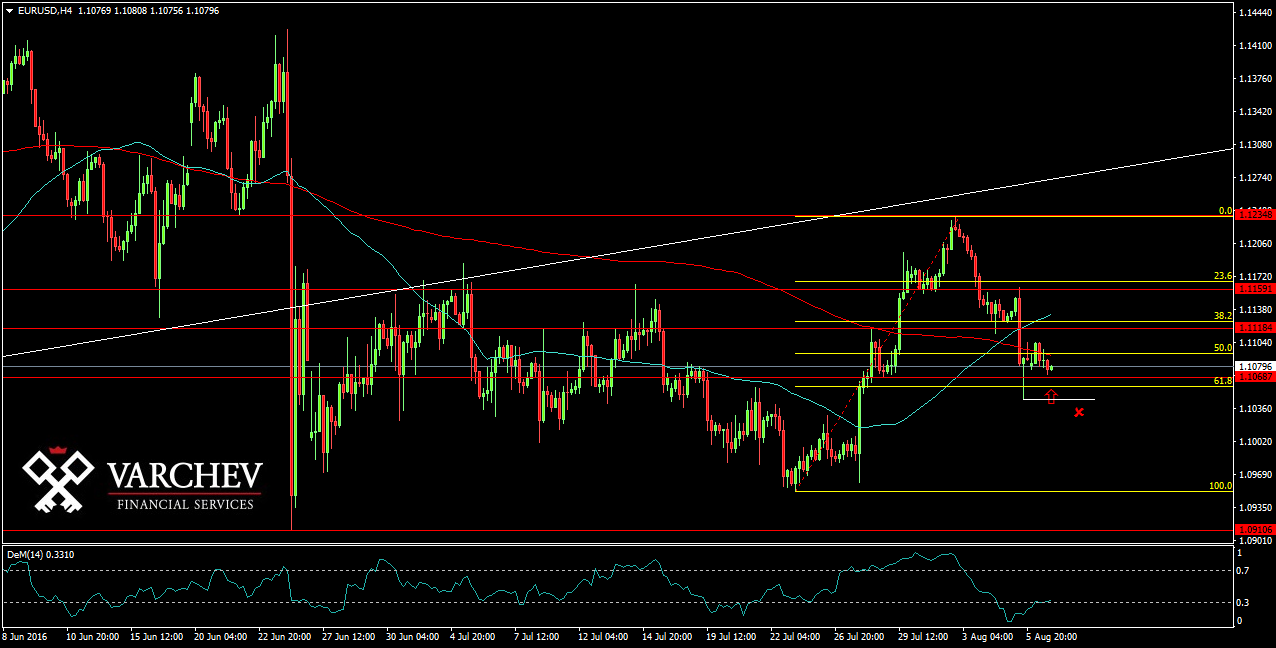
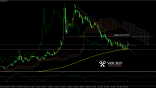
H4 Graph: Choppy/Sideways, in Range
After the price reached resistance at 1,12350 came down to level of very good support at 1,10700. Its the second time price stops here and holds this level Now this level is the same as the Fib 61,8% of the previous long move up.
Price Action - Pin bar at this level - Possible signal for new long.

Alternative scenario: If the price moves below the Fib 61,8% and below 1,10500, will cancel the bullish view.
Technical Indicator:
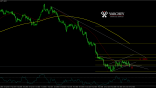
DEM (14) - In oversold zone and turned up for long
Price for Entry long around: 1,10600
SL: 1.10350
Jr. Trader - S. Fuchedzhiev
 Varchev Traders
 Read more:
RECCOMEND
WAS THIS POST USEFUL FOR YOU?
If you think, we can improve that section,
please comment. Your oppinion is imortant for us.
If you think, we can improve that section,
please comment. Your oppinion is imortant for us.

