

- Home
- >
- FX Daily Forecasts
- >
- Forex: AUD/JPY with potential formation “Reversed Head and Shoulders”

Forex: AUD/JPY with potential formation "Reversed Head and Shoulders"
Rating:

AUD/JPY
Time frame: D1, H4
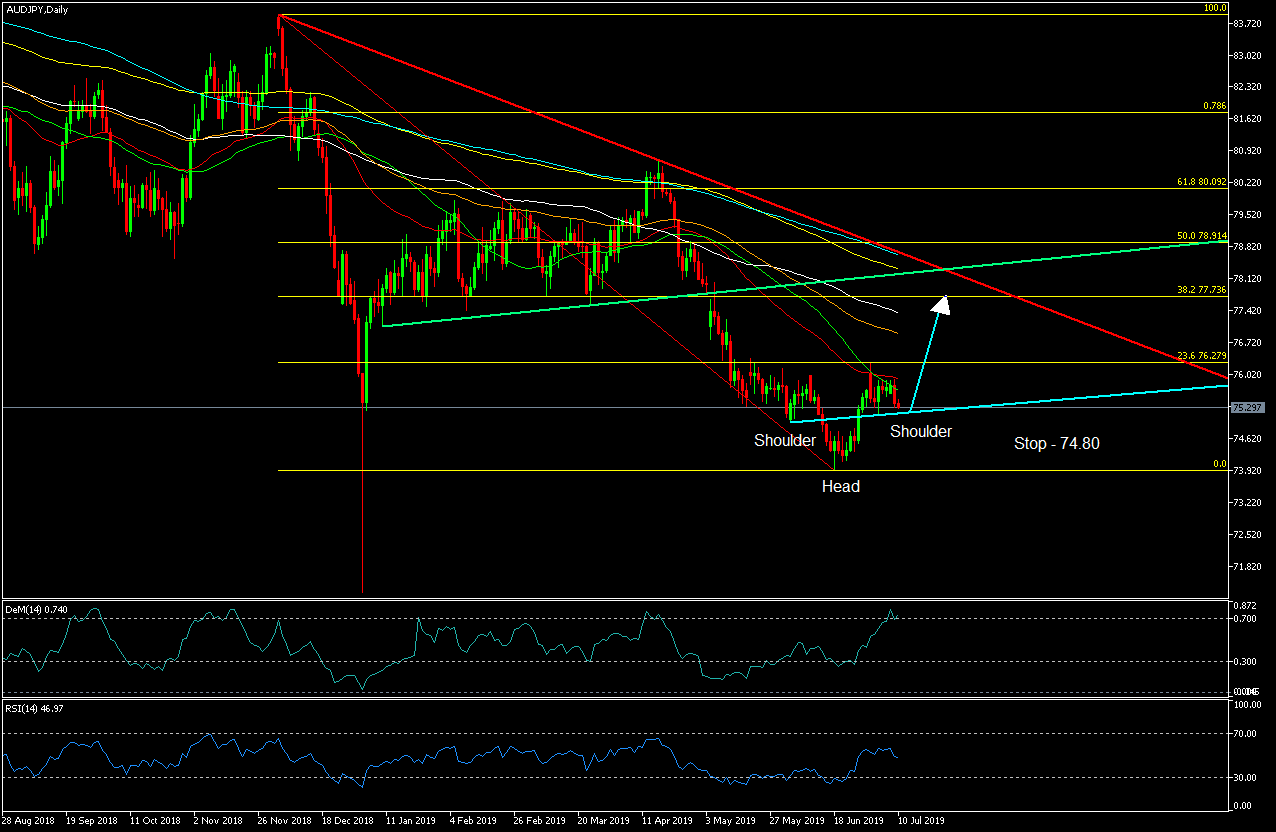
Technical analysis: The AUD/JPY currency pair chart shows an exceptionally strong downward trend. On 18.06.19 the price recorded a new bottom at 73.90 from where it headed north. At this point we build Fibonacci from the top at level 83.90 to the bottom at level 73.90. As the chart shows, the price has reached the first strong resistance at 23.6% on Fibonacci from where it reversed the direction. With this, the AUD/JPY began to form a "Reversed Head and Shoulders" formation. If we open a 4-hour time frame, it can be seen that the price is just below 38.2% on Fibonacci, built from the bottom at 73.90 to the top at 76.30. This gives a signal that the price has not yet ended the shoulder, and it is possible that it will continue its adjustment to 100 SMA and the current support of the formation (Light Blue Trend Line). If this happens, we have two options for entering the market:
Aggressive market entry: Direct purchases when reaching the above-mentioned support.
Conservative entry into a deal: A price action formation to signal that the correction is over.
SL: 74.80
Indicators: On a daily time frame, the RSI indicator is around 50%, indicating that there is a likelihood of a subsequent rise.
The DeM indicator is over 0.70 and does not support the "buy" scenario at this stage.
On a 4-hour time frame, both indicators are in their over-sold values, which supports the "buy" scenario.
Alternative scenario: If the price succeeds in breaking the support of 100 SMA and 50% of Fibonacci, then we can see a drop to 61% Fibonacci from where to look for new opportunities.

 Trader Milko Zashev
 Read more:
 Good price to buy British Pound
 Forex Intraday: EUR/USD has reached strong resistance
 Forex: AUD/JPY “Buy” from current levels
 Alexandre Lamfalussy: “We need to admit the euro was a mistake”
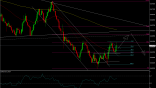 NZD / USD, mixed signals from price action and formations. More likely long after the activation of a flag for increace
If you think, we can improve that section,
please comment. Your oppinion is imortant for us.

