

- Home
- >
- FX Daily Forecasts
- >
- Forex: Buy GBP/CAD from current levels

Forex: Buy GBP/CAD from current levels
Rating:

GBP/CAD
Time frame: H4
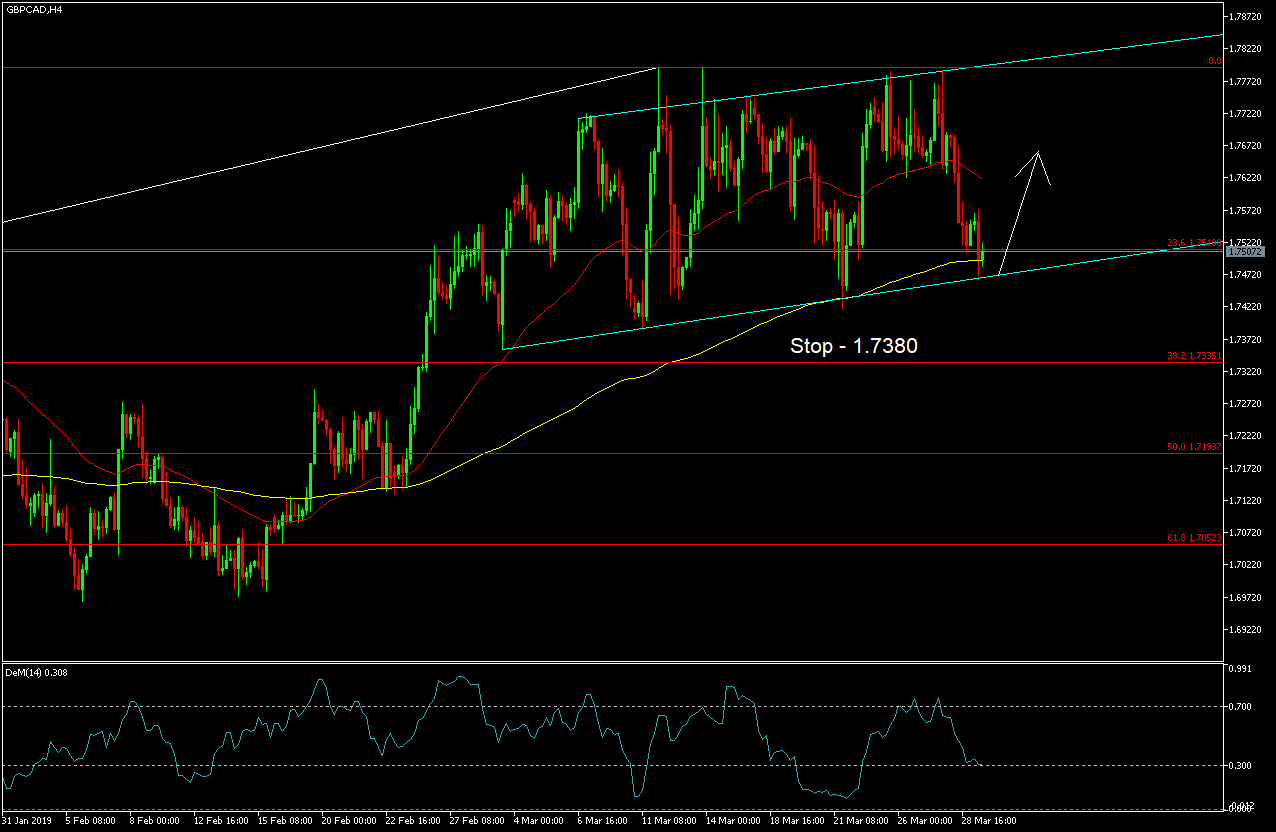
Technical analysis: The chart shows that the pair is moving upward and has formed a Flag formation. The price is on the support of the formation, and it coincides with 200 EMA. Meanwhile, on a daily chart, the price was reached 23.6% of Fibonacci, which is considered as support. Judging by the fact that the pair is on the upside, purchases would be more likely.
Indicators: The price is over 200 EMA, and it plays a role of strong support.
The price is below 50 EMA, and it plays a role of resistance.
DeM - in over-sold values which supports the "buy" scenario.
Entry into Deal: From current levels
SL: 1.7380
Alternative Scenario: If the price can break through the support of the formation and 200 EMA, it will continue to decline.

 Trader Milko Zashev
 Read more:


If you think, we can improve that section,
please comment. Your oppinion is imortant for us.

