

- Home
- >
- FX Daily Forecasts
- >
- Forex: EUR/GBP is approaching key resistance

Forex: EUR/GBP is approaching key resistance
Rating:

EUR/GBP
Time frame: D1
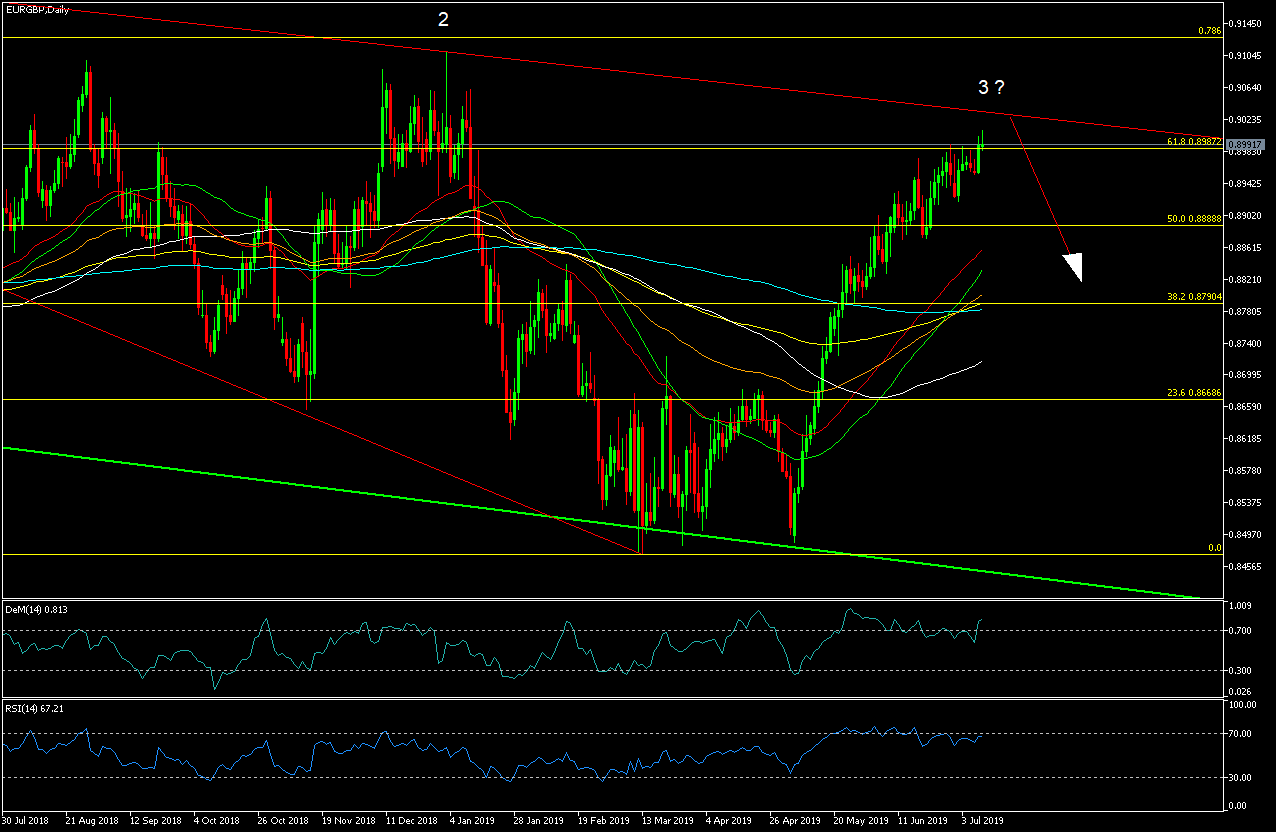
Technical analysis: The chart of EUR/GBP shows that the price is moving in a downward trend channel. Once it registered a bottom at level 0.8470, it headed steadily northward. For ten weeks in a row, the price broke resistance after resistance, currently around the key resistance of the downward trend channel, as well as at Fibonacci 61.8. The RSI and DeM indicators go out of their over-bought values, and the price continues to make new peaks. This signals the presence of divergence, which supports sales in reaching diagonal resistance.
Alternative scenario: If the price can break through and hold over the key resistance, then it can continue its upward trend to the previous peaks at 0.9050.

 Trader Milko Zashev
 Read more:
 Good price to buy British Pound
 Forex Intraday: EUR/USD has reached strong resistance
 Forex: AUD/JPY “Buy” from current levels
 Alexandre Lamfalussy: “We need to admit the euro was a mistake”
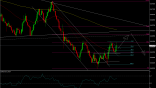 NZD / USD, mixed signals from price action and formations. More likely long after the activation of a flag for increace
RECCOMEND
WAS THIS POST USEFUL FOR YOU?
If you think, we can improve that section,
please comment. Your oppinion is imortant for us.
If you think, we can improve that section,
please comment. Your oppinion is imortant for us.

