

- Home
- >
- FX Daily Forecasts
- >
- Forex: GBP/NZD with opportunities for “sell”

Forex: GBP/NZD with opportunities for "sell"
Rating:

GBP/NZD
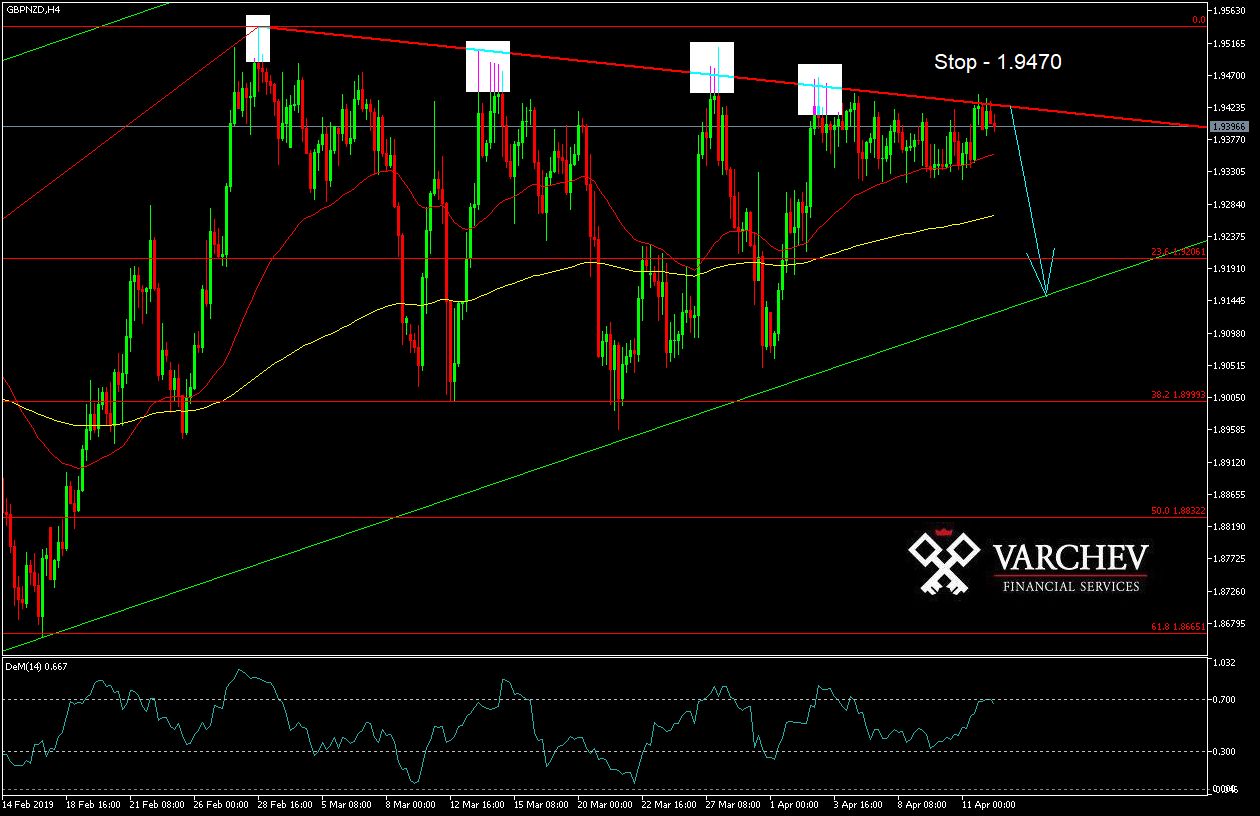
Time frame: H4
Technical Analysis: The chart shows that the price is in a up trend. Right now we can see that the price is attacking a strong trend line for the fifth time in a row, failing to break it. By doing so, the pair forms a "Multiple High" formation, and sales from here would be more likely.
Indicators: The price is over 50 and 200 EMA, and for the moment they play a role of support.
DeM- Overbought values that support the "Sell" scenario.
Entry into Deal: From current levels
SL: 1.9470
Alternative scenario: If the price can break through and stay above the current resistance (the red trend line) then it will continue to rise.

 Trader Milko Zashev
 Read more:
 Good price to buy British Pound
 Forex Intraday: EUR/USD has reached strong resistance
 Forex: AUD/JPY “Buy” from current levels
 Alexandre Lamfalussy: “We need to admit the euro was a mistake”
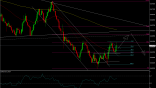 NZD / USD, mixed signals from price action and formations. More likely long after the activation of a flag for increace
RECCOMEND
WAS THIS POST USEFUL FOR YOU?
If you think, we can improve that section,
please comment. Your oppinion is imortant for us.
If you think, we can improve that section,
please comment. Your oppinion is imortant for us.

