

- Home
- >
- FX Daily Forecasts
- >
- Forex: GBP/USD monitored for purchases

Forex: GBP/USD monitored for purchases

Rating:

GBP/USD
Time frame: H4, D1
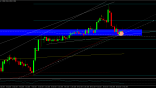
Technical analysis: The chart shows that in the last few trading sessions the price of the currency has been moving between 1.2400 and 1.2200 levels. Currently, the price is in the middle of this range at 1.2300. It is also below the average of the Bollinger Bands indicator. At this stage, this average plays the role of resistance and it is possible to see a drop to its bottom line. At the moment, it also perfectly coincides with the diagonal trend line, taken together they form a strong resistance around the 1.2260 area. When this support is reached, it is possible to see a price rebound and a new uptrend.
If we look at the daily time frame, it can be seen that the trend line supports 50 SMA as well, which gives an additional indication that the 1.2250 level is likely to provide strong support.
The first target is on the downward trend line. It plays the role of resistance. If it is pierced then we can see a prolonged rise to previous peaks at 1.2550.
Alternative scenario: If the price fails to hold the support and breaks it, then it will continue to fall for the support level test at 61.8% Fibonacci.

 Trader Milko Zashev
 Read more:
 Good price to buy British Pound
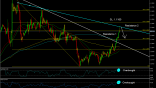 Forex Intraday: EUR/USD has reached strong resistance
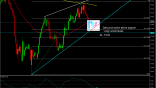 Forex: AUD/JPY “Buy” from current levels
 Alexandre Lamfalussy: “We need to admit the euro was a mistake”
 NZD / USD, mixed signals from price action and formations. More likely long after the activation of a flag for increace
If you think, we can improve that section,
please comment. Your oppinion is imortant for us.

