

- Home
- >
- FX Daily Forecasts
- >
- Forex Intraday: GBP/USD “sell” after a test of the resistance of the new downward trend

Forex Intraday: GBP/USD "sell" after a test of the resistance of the new downward trend
Rating:

GBP/USD
Time frame: H1
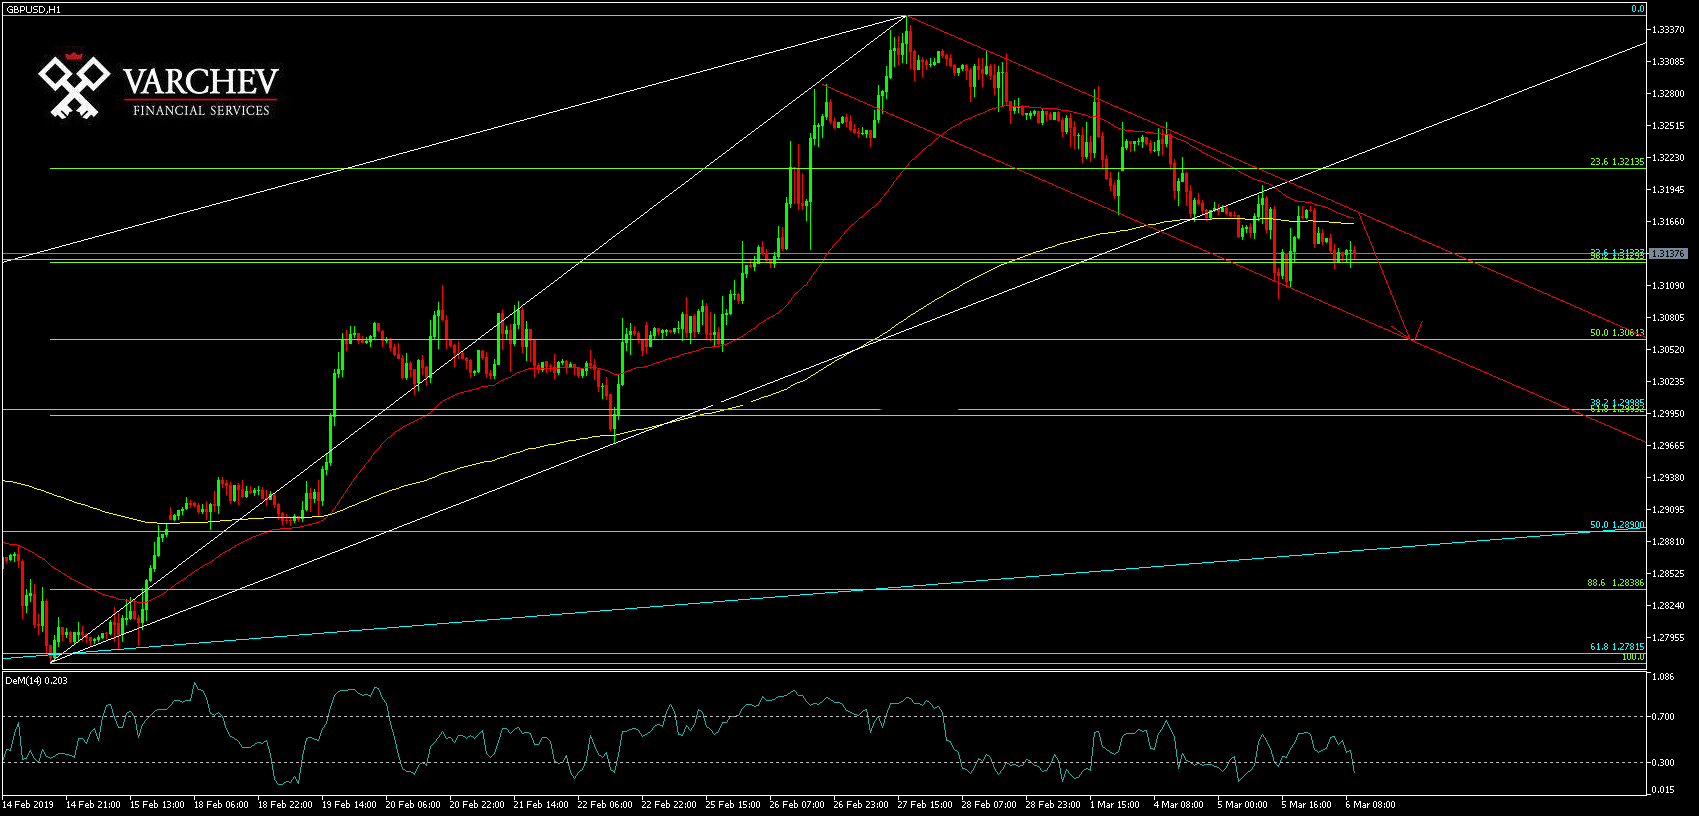
Technical analysis: After the pair tested the upward trend, it quickly headed south.
GBP / USD managed to touch the support of the newly formed downward trend and then recovered most of the losses to close the day flat. Since the price is now over 23.6% and 38.2% on Fibonacci, it is more likely to test the resistance of the new downward trend channel. After a test, we can position "Sell".
Indicators: The price is below 200 and 50 EMA, which for the time being indicate a strong resistance to the price.
DeM - Over-sold values that support the correction to trend channel resistance
SL: 1.3200
Alternative Scenario: In case of a break of the downward trend, the price will continue to rise until the next resistance around 1.3215
 Trader Milko Zashev
 Read more:
 Good price to buy British Pound
 Forex Intraday: EUR/USD has reached strong resistance
 Forex: AUD/JPY “Buy” from current levels
 Alexandre Lamfalussy: “We need to admit the euro was a mistake”
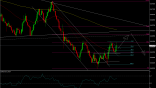 NZD / USD, mixed signals from price action and formations. More likely long after the activation of a flag for increace
If you think, we can improve that section,
please comment. Your oppinion is imortant for us.

