

- Home
- >
- FX Daily Forecasts
- >
- FOREX: “SELL” NZDCAD within main trend

FOREX: "SELL" NZDCAD within main trend
Rating:

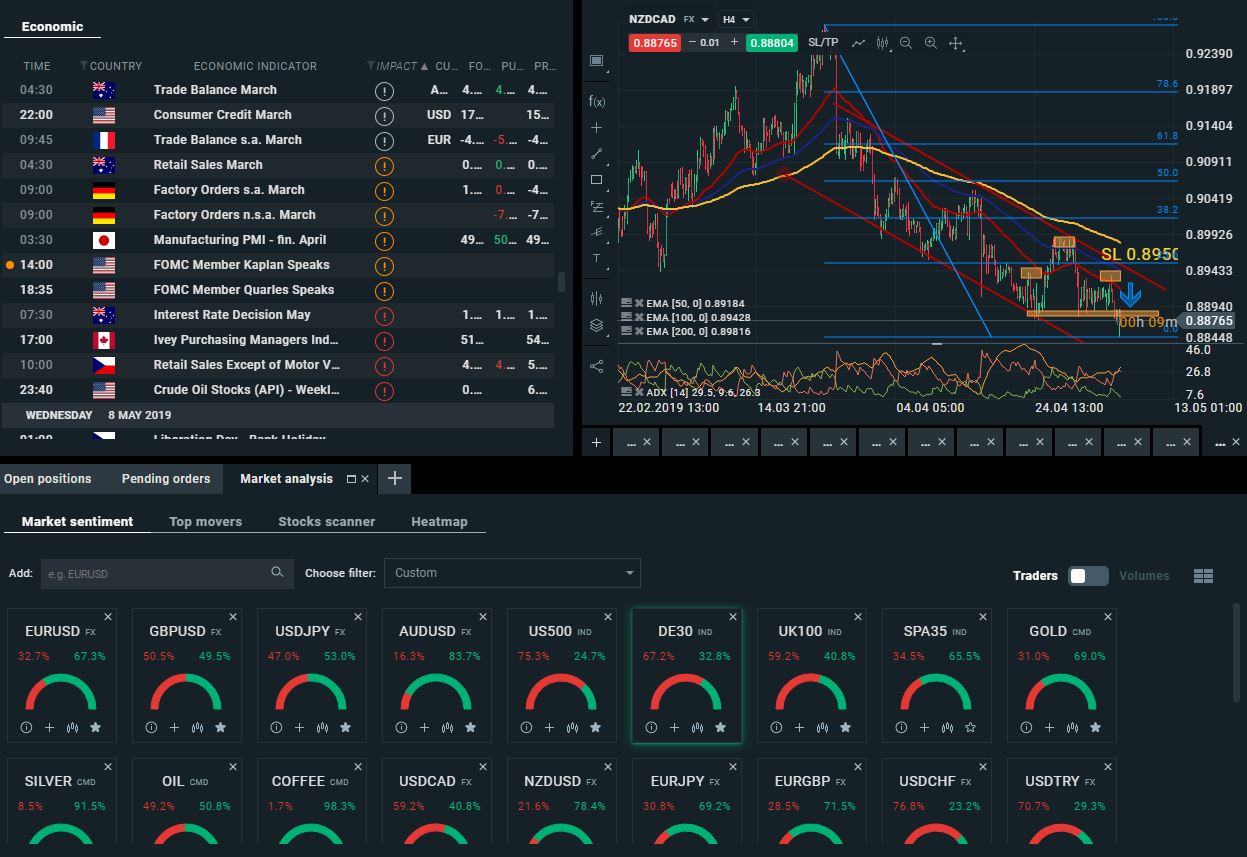
NZDCAD
Timeframe: H4
Technical Analysis: The price has formed a "Head to Shoulder" formation at 23.6% Fibonacci retracement in the downward movement launched in March 2019. We have a neck-line breakthrough and an important support of 0.8900.
Indicators: The price is below 50-DMA, 100-DMA and 200-DMA to support sales.
ADX: The indicator is in favor of short positions.

Entry: Aggressive entrance at current prices at 0.8877, with more conservative traders could wait for the decision of the New Zealand Central Bank to declare interest rate on 8.05.2019 at 05:00 GMT +3
SL: 0.8950
Alternative Scenarios: If the price is able to close above 0.89-90, we will probably see a return to the main upward trend in NZDCAD formed in September 2018.
 Trader Velizar Mitov
 Read more:
 Good price to buy British Pound
 Forex Intraday: EUR/USD has reached strong resistance
 Forex: AUD/JPY “Buy” from current levels
 Alexandre Lamfalussy: “We need to admit the euro was a mistake”
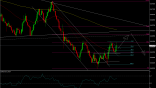 NZD / USD, mixed signals from price action and formations. More likely long after the activation of a flag for increace
If you think, we can improve that section,
please comment. Your oppinion is imortant for us.

