

- Home
- >
- FX Daily Forecasts
- >
- FOREX:Technical signal for “Buy” USDJPY

FOREX:Technical signal for "Buy" USDJPY
Rating:

USDJPY
Time Frame: H4
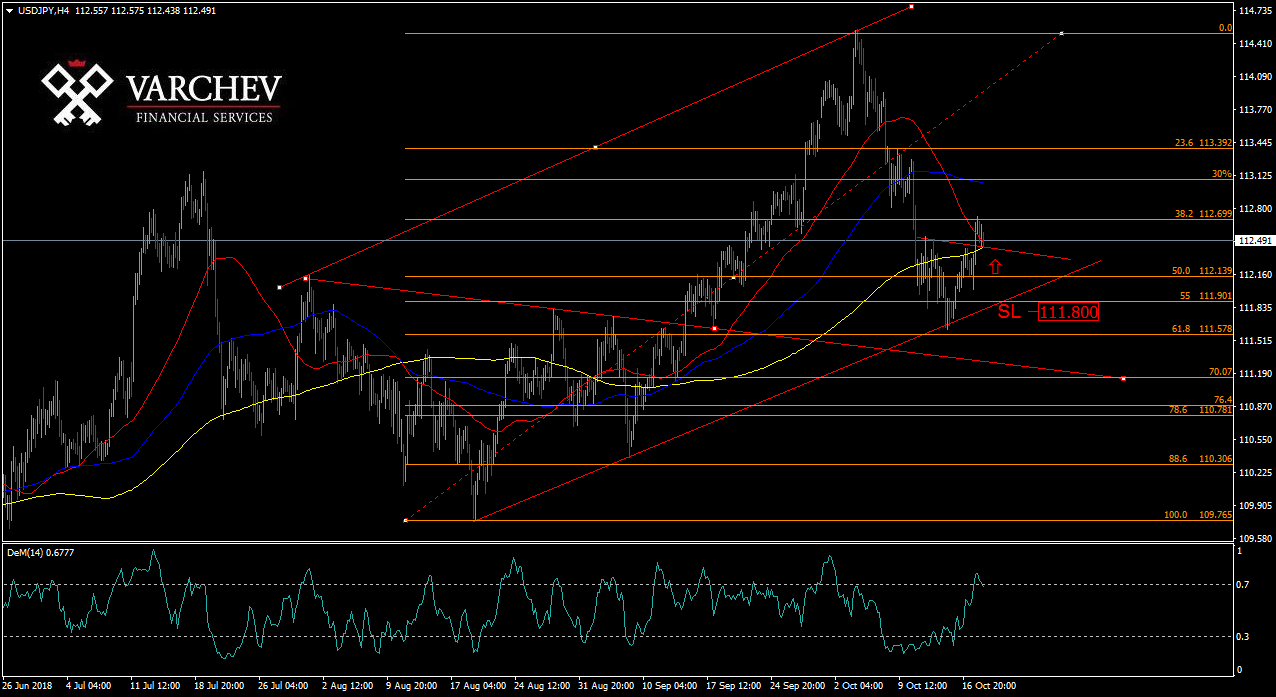
Technical Analysis: The price has formed trend reversal formation "Head & Shoulders" at retracment zone of support at 50%- 55% Fibo from upside movement started on 21.08.2018.
Indicators: The price is above 50 & 200 MA ; the 200 MA zone supports the "neckline"of the formation at ~112.50 ,which supports bullish scenario.
Dem(14): We don`t have any signals from the indicator.
Вход: Aggressive enter is at 112.30-112.50. Conservative enter will be after clear signal from "Japanese Candle stick" theory around "neckline" zone of the "Head & Shoulders"
SL: 111.80

Alternative scenario: If the price close below 55-DMA the bullish scenario will be terminated and the focus will be on support zone at 100 DMA.
 Trader Velizar Mitov
 Read more:
 Good price to buy British Pound
 Forex Intraday: EUR/USD has reached strong resistance
 Forex: AUD/JPY “Buy” from current levels
 Alexandre Lamfalussy: “We need to admit the euro was a mistake”
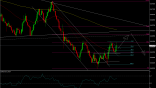 NZD / USD, mixed signals from price action and formations. More likely long after the activation of a flag for increace
RECCOMEND
WAS THIS POST USEFUL FOR YOU?
If you think, we can improve that section,
please comment. Your oppinion is imortant for us.
If you think, we can improve that section,
please comment. Your oppinion is imortant for us.

