

- Home
- >
- Trading University
- >
- Forget about candlestick formations – here’s all you need to know

Forget about candlestick formations - here's all you need to know
Rating:

Understanding candle patterns far outweighs just memorizing and recognizing certain formations. Many books on candle patterns were written, involving hundreds of different formations that supposedly provide secret information on what will happen next.
The truth is, it will not matter for your commercial effectiveness, whether you know what Concealing Baby Swallow, Three Black Crows or Unique Three River Bottom.
The Four Candle Elements
Step 1: The War of Japanese Candles
Before we start going into actual candles, it's important to be in the right way of thinking.
Let's think of price movements as a war between bulls and bears. Each candle is a battle in a total war and the 5 candle elements tell us who's ahead, who pulls back, who controls, and who has a better chance of winning the next battle.
Step 2: Everything is related to the context
It is crucial to understand that candles can not be seen only in a vacuum. The candle should always be analyzed in the context of what happened in the past. So when we try to analyze candles or formation, we have to ask these questions:
Is the current candle bigger or smaller than the previous one?
Does the size change meaningfully or not?
Does the change happen during an inactive trading period? For example, EUR Forex couples tend to shrink in size during the quieter Asian session.
This is a good starting point because it helps us avoid the closed mindset that limits many traders. Now we can start to explore the four elements:
Element 1: The size of the body
The candle body is a great starting point because we can get a lot of information from it.
A long body shows strength
When the bodies become larger, it shows an increase in inertia
When the bodies become smaller, this indicates a slowing of inertia
The body shows how far the price has passed during the candle.
Element 2: The length of the shadow
The shadow can show the volatility of price movements.
Larger shadows show that the price has shifted much during the candle but is rejected
When shadows become bigger, it shows an increase in volatility. This often happens after long phases of trends before a turnaround occurs. Or on a high level of support and resistance.
Element 3: The Body-Shadow Ratio
Now let's tie things up
Do you see longer shadows or bodies?
At high rate of inertia you can often see long bodies with small shadows
When uncertainty rises, volatility rises and bodies become smaller until shadows become bigger
Element 4: The position of the body
This is a continuation of the previous point.
Can you see a long shadow with a body on the other side? This often indicates rejection
When you have a small body in the middle of a candle with long shadows, it means indecision
You see that once we begin to combine the information provided by shadows and bodies, we can practically analyze all Japanese candle formations.

Examples
Now that we have covered the individual elements, we can unite things and see how we can use our knowledge to distinguish the price charts.
Example
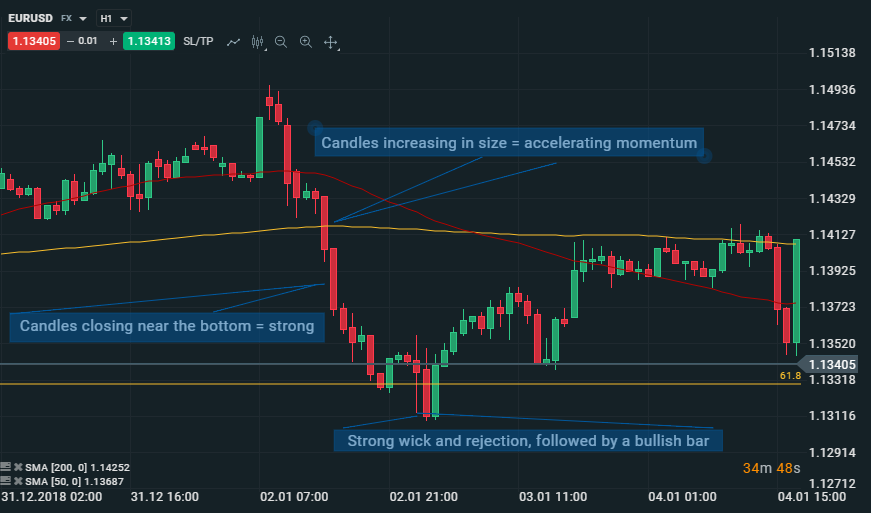
Let's follow the price in the graph below and share what we see here
During downward trend, the candles are only red (bearish) and long with very small or no shadow & gt; & gt; this shows strength
At the bottom we see rejection. This is still not enough to call it a reversal, but the next candle begins to see bullish candles

Conclusion: There is no need for candle formations
With this article we want to show you that you do not have to remember any candle formation to find out what's going on. Exactly the opposite. It is very important in your path to become a professional and profitable trader, to start thinking outside the box and to avoid the usual mistakes of the beginners. Learn how to understand how buyers and sellers push the price, who controls and who loses control.
 Trader Aleksandar Kumanov
 Read more:


If you think, we can improve that section,
please comment. Your oppinion is imortant for us.

