

- Home
- >
- FX Daily Forecasts
- >
- GBP/USD: sentiment and technical analysis

GBP/USD: sentiment and technical analysis
Rating:

Sentiment
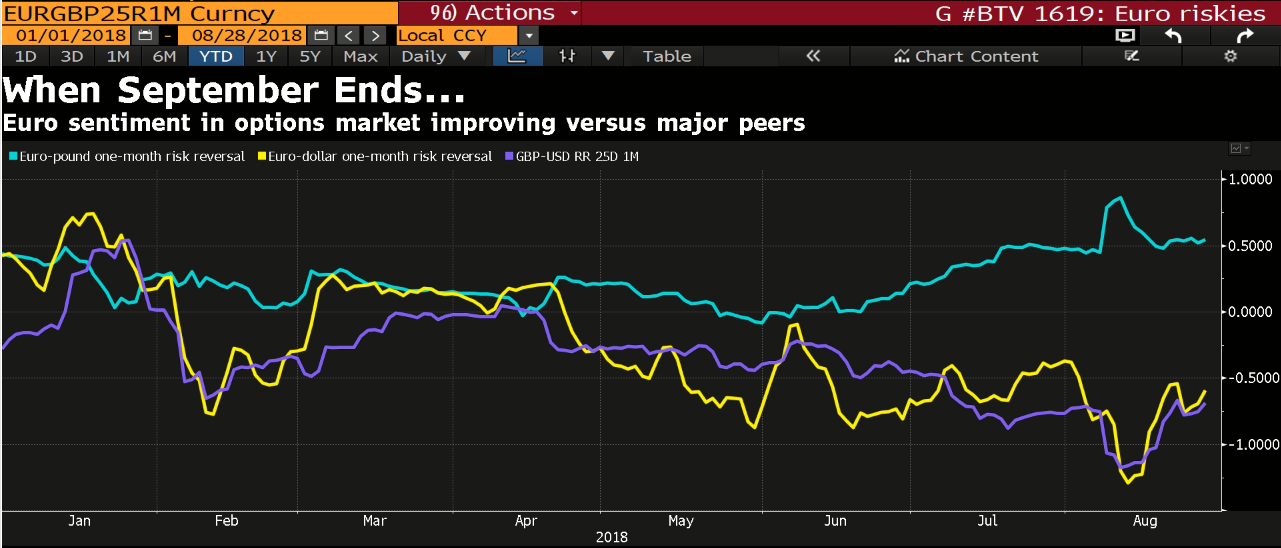
The risk of a no-deal Brexit is especially clear for traders and investors months before the Brexit deal deadline this December. The options market clearly shows the changes in investor sentiment over the past 1 year:

The chart measures how much more expensive (if above 0) or cheaper (if below 0) are call options relative to put options. For example, the purple line (GBP/USD 1 month options) is at -0,71, which means that calls are significantly cheaper: this is because investors and traders are bearish on the pound and bullish on the dollar for the next 1 month.
In the middle of August 2018 pessimism for the euro and the pound reached its peak: see the yellow and purple lines. The question is whether the positive sentiment will persist.
The current levels of the GBP/USD are around 1,29, while the bottom for the pair is at 1,205, which was the reaction to the Brexit referendum. This shows us that the market is taking account of Brexit, though not fully, perhaps because of the chance of a favorable deal with the EU. This can also be seen in EUR/GBP: the pair trades at 0,905, which is the 1-year high.
Technical analysis

On the daily chart the GBP/USD pair forms a support level around 1,26-1,265 (the bottom from 21.06.2017). The pair is in a correction of the overall downwards trend. The strength of the bearish trend can be seen from the DeMarker, which has been making lower highs for the past 1 year. As a signal for a continuation of the upwards trend we will monitor the DeMarker for a breakout above the trendline. If it does, we expect the next resistance to be around the 23,6% Fibonacci retracement level (blue), which also coincides with the 50- and 100-day MA.

On the weekly chart the DeMarker is pointing straight up from oversold levels, though it still hasn't breached the 0,3 level to initiate a potential buy signal. A breakout above 1,325 will meet significant resistance at 1,4. This is a Fibonacci cluster level, as well as the level of the downwards sloping trendline from the end of 2007. If a breakout above 1,325 does not occur, we expect next support at the neckline near 1,26.
For short-term gains with the correction we recommend long positions with the signal being a breakout above the resistance line on the DeMarker.
Stop-loss: we recommend tight stops, due to the high risk in counter-trend positions - around 1,286.
In the long-term, the trader has to keep in mind the potential formation of a head and shoulders if the resistance at 1,325 holds; with the neckline around 1,265-1,265. This is why we will track GBP/USD for a potential short position in the long-term.
At this point, especially considering the fundamentals, we believe that long positions on EUR/USD offer a better risk-reward ratio for capitalizing on the improving sentiment. Considering the weakening fundamentals in Great Britain, especially the negative financial balance of the private sector, we find long positions on GBP too risky.
Source: Bloomberg Finance L.P.
Chart: Used with permission of Bloomberg Finance L.P.
 Varchev Traders
 Read more:
 GBPBGN: increase in price is more probable from the current levels
 EURGBP: probability for an upcoming downward impulse
 GBPUSD short term sentiment in front of important data at 11:30 (GMT+3)
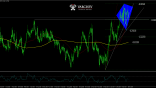 A price below 2.268 can lead to a new decline by the pound
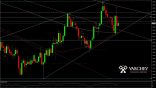 Pound rises after the defeat of May’s Brexit deal
If you think, we can improve that section,
please comment. Your oppinion is imortant for us.

