

- Home
- >
- FX Daily Forecasts
- >
- GBP/AUD possibility for short positions

GBP/AUD possibility for short positions
Rating:

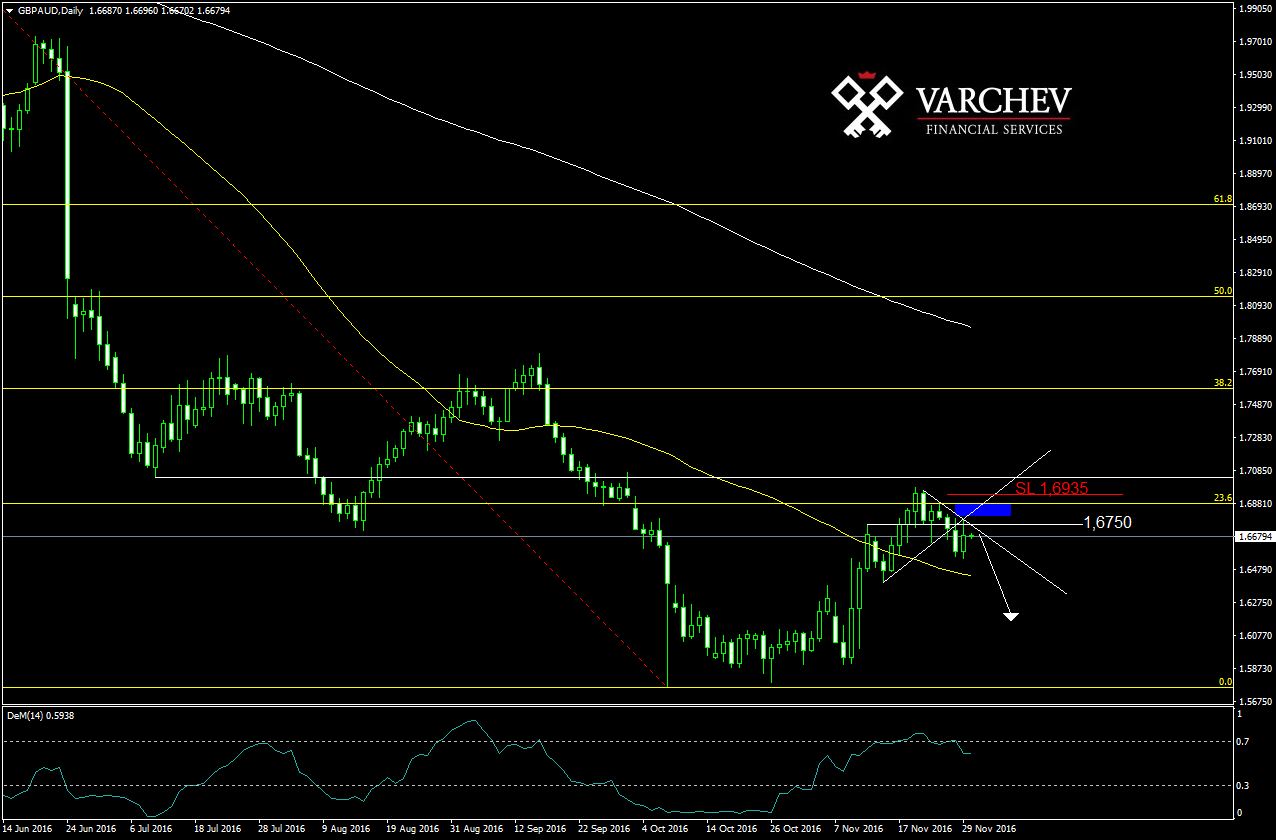
GBP/AUD 30.11.2016 D1 chart.
Long term downtrend and correction to 23,6 Fibonacci.
Break brelow diagonal and horizontal supports (current resistances) and test of the break.
Last bar makes lower low and closes below the high of the previous bearish bar- negative signal.
Techncial indicators:
SMA50 below SMA200 - negative signal
DeM(14) reverses above 0,7 and breaks below - negative signal
We can wait a correction aroung1,6750 to minimize risk.
SL 1,6935
Alternative scenario: If price breaks above the resistances this will negate the negative scenario.
Jr. Trader Nikolay Georgiev
 Varchev Traders
 Read more:
 FOREX: Bulls on EURUSD with sight for 1.1300; Основни подкрепи и съпротиви 16.05.2019
 How to trade the AUDJPY breakout
 AUDNZD multiple signals that the bottom is close
 AUD at key technical levels, but the data for China weighs on the fundament
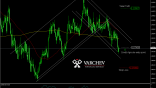 Crédit Agricole with Long recommendation of AUD/NZD – SL: 1.0590 – TP: 1.1050
RECCOMEND
WAS THIS POST USEFUL FOR YOU?
If you think, we can improve that section,
please comment. Your oppinion is imortant for us.
If you think, we can improve that section,
please comment. Your oppinion is imortant for us.

