

- Home
- >
- FX Daily Forecasts
- >
- GBP/AUD: Possible move lower from here by the Big Trend down

GBP/AUD: Possible move lower from here by the Big Trend down
Rating:

GBP/AUD:
Date: 21 November, 2016
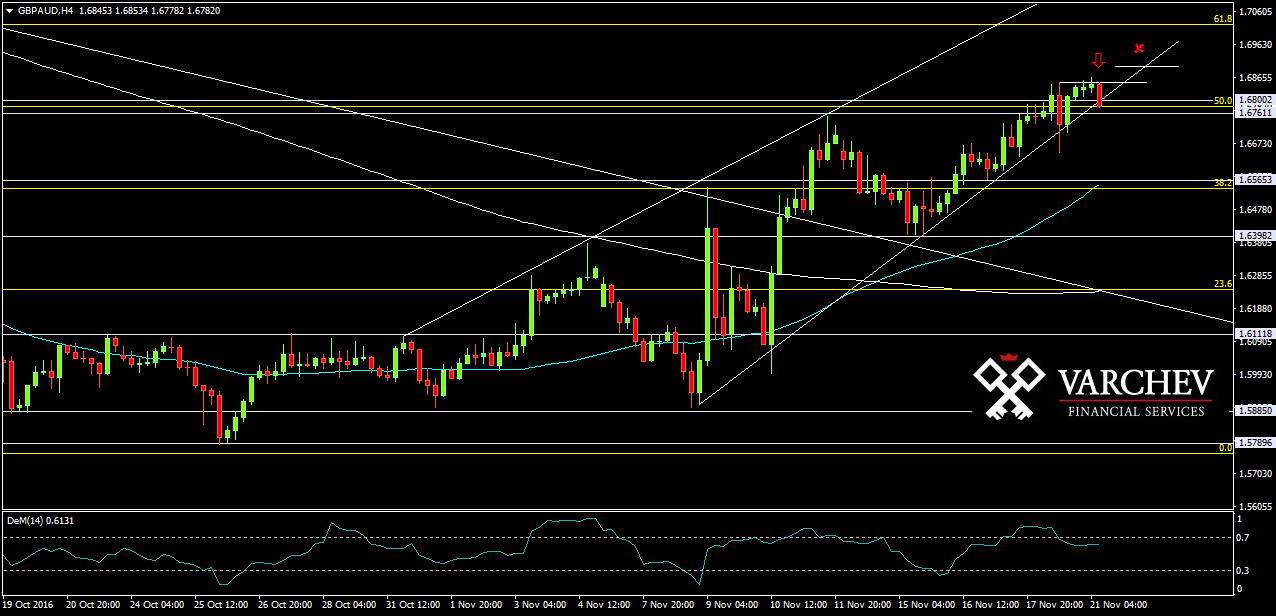
H4 Graph: Long Term short
Price found a bottom at 1.58 and started going up. Now price reached the important Fib level of 50% from the previous move lower and strong horizontal resistance. Second relatively big bearish bar at level of resistance without a new high. Possible signal for end of the current up move and the start of down impulse.
Price Action: Engulfing bar at a level of horizontal resistance - Possible signal for short.

Alternative scenario: If the price move up above the prevous high and above 1.68600 this will cance the bearish scenario.
Technical Indicator:
DEM (14) - Close to the overbought zone and turned down for short
Price for Entry short around: 1.6790
SL: 1.68900
Jr. Trader - S. Fuchedzhiev
 Varchev Traders
 Read more:
 FOREX: Bulls on EURUSD with sight for 1.1300; Основни подкрепи и съпротиви 16.05.2019
 How to trade the AUDJPY breakout
 AUDNZD multiple signals that the bottom is close
 AUD at key technical levels, but the data for China weighs on the fundament
 Crédit Agricole with Long recommendation of AUD/NZD – SL: 1.0590 – TP: 1.1050
If you think, we can improve that section,
please comment. Your oppinion is imortant for us.

