

- Home
- >
- FX Daily Forecasts
- >
- GBP/AUD: Possible new short after correction

GBP/AUD: Possible new short after correction
Rating:

GBP/AUD:
Date: May 2, 2016
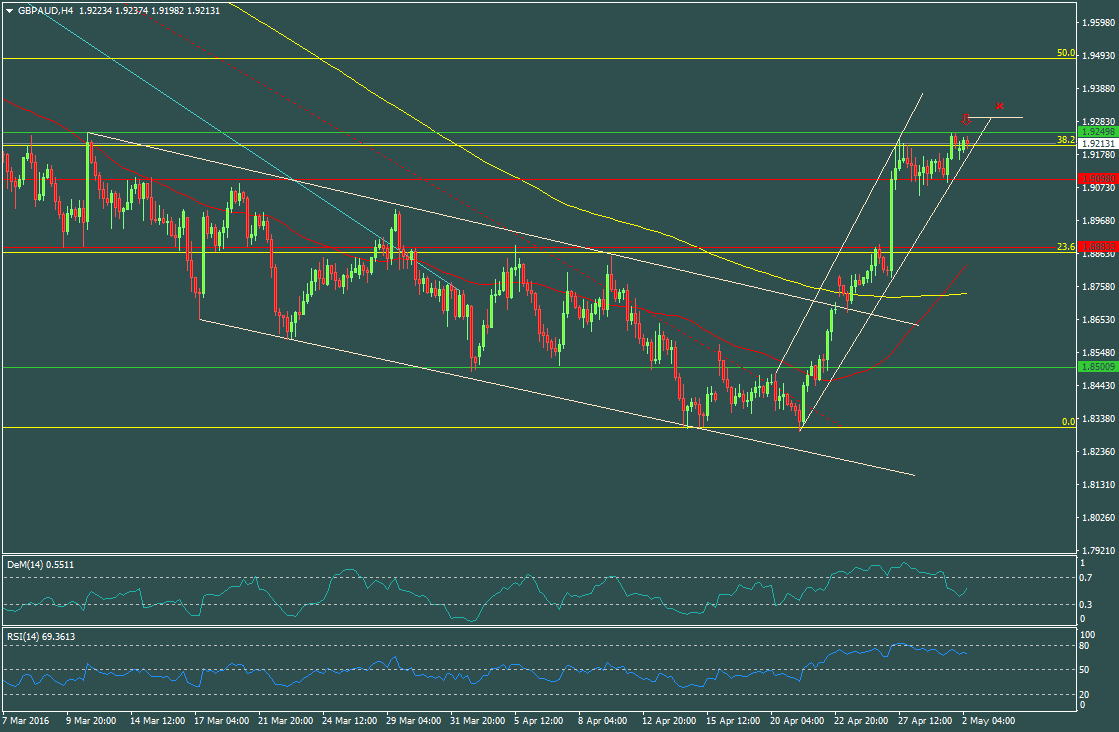
H4 Chart: short trend at H4 and D1
The price made a correction at Fibo 38,2% on short trend. A "Double Top" formation at levels of horizontal resistance.
The price holds at Fibo 38,2% on horizontal resistance and a possible "Double Top" formation

Alternative scenario: If the price goes up above the horizontal resistance at 1,92500 and above 1,929 will break the bear scenario .
Indicators:
DEM (14) H4 - Is still not in overbought zone
RSI (14) H4 - The indicator was in overbought zone and spuned down for short - Waiting for a short signal from the indicator after going below 50.
Price for entry short around 1,92350
SL: 1.92950
Jr. Trader: S. Fuchedzhiev
 Varchev Traders
 Read more:
 GBPBGN: increase in price is more probable from the current levels
 EURGBP: probability for an upcoming downward impulse
 GBPUSD short term sentiment in front of important data at 11:30 (GMT+3)
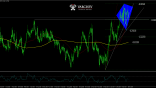 A price below 2.268 can lead to a new decline by the pound
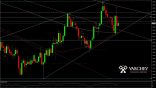 Pound rises after the defeat of May’s Brexit deal
RECCOMEND
WAS THIS POST USEFUL FOR YOU?
If you think, we can improve that section,
please comment. Your oppinion is imortant for us.
If you think, we can improve that section,
please comment. Your oppinion is imortant for us.

