

- Home
- >
- FX Daily Forecasts
- >
- GBP/USD: Long move is in force, long after short correction

GBP/USD: Long move is in force, long after short correction
Rating:

GBP/USD:
Data: 7 September, 2016
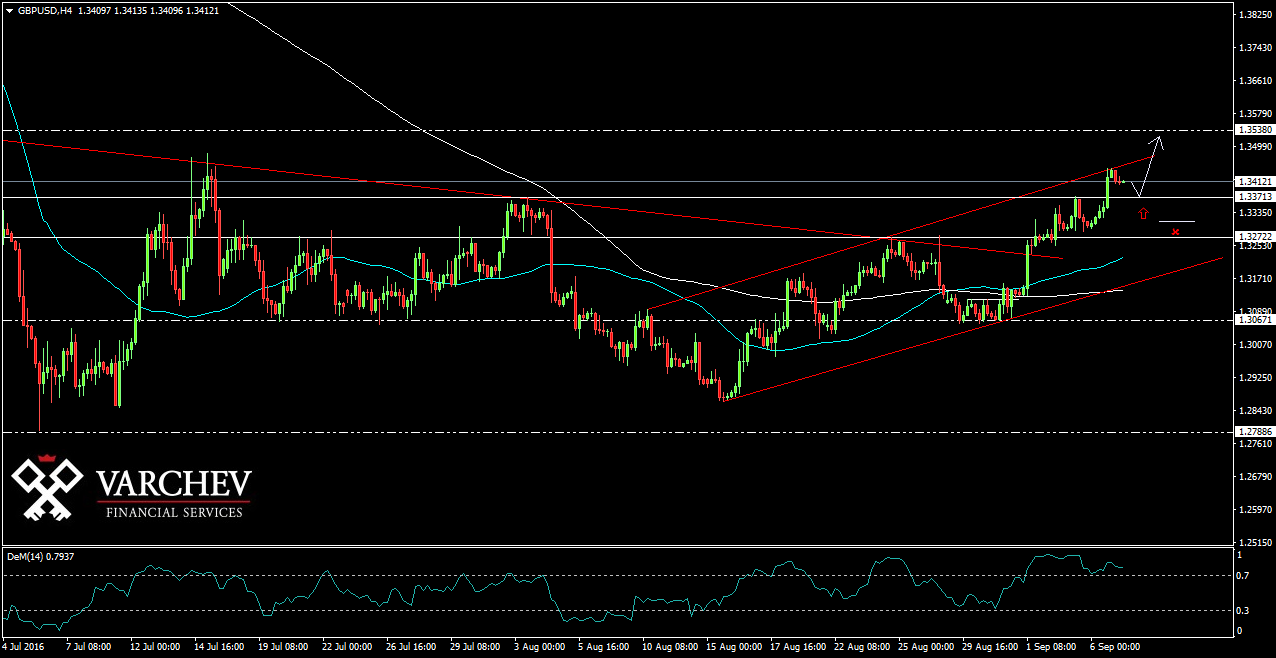
H4 Graph: Long term short, Short term long
The price started going up after found support at horizontal support at 1,307 and then it broke resistance at 1,3270. Now the price is breaking the next horizontal resistance at 1,3370 and after retest and small correction we can still look for longs for up to 1,3540. The price has formed visible bullish channel.

Alternative scenario: If the price breaks below the horizontal support at 1.337 and below 1.331 will cancel the bullish call.
Technical Indicator:
DEM (14) - In the overbought zone
Price for Entry Long around: 1,337
SL: 1.33100
Jr. Trader - S. Fuchedzhiev
 Varchev Traders
 Read more:
 GBPBGN: increase in price is more probable from the current levels
 EURGBP: probability for an upcoming downward impulse
 GBPUSD short term sentiment in front of important data at 11:30 (GMT+3)
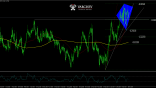 A price below 2.268 can lead to a new decline by the pound
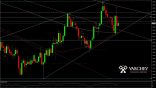 Pound rises after the defeat of May’s Brexit deal
RECCOMEND
WAS THIS POST USEFUL FOR YOU?
If you think, we can improve that section,
please comment. Your oppinion is imortant for us.
If you think, we can improve that section,
please comment. Your oppinion is imortant for us.

