

- Home
- >
- FX Daily Forecasts
- >
- GBP/USD: Price Action signal for short

GBP/USD: Price Action signal for short

Rating:

GBP/USD:
Date: 25 November, 2016
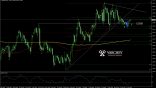
H4 Graph: Short Trend
The price is making a new third lower high and this is forming at Fibo level of 50% from the prevouis move short. The price remains below the horizontal resistance of 1,25110 after a retest and now the price is testing the diagonal resistance. We expect the price to remain witin the bearish price channel and continue short.
Price Action: Doji bar at horizontal and diagonal resistance - Possible signal for short.

Alternative scenario: if the price continue to go higher and passes over the high of the doji bar and horizontal resistance of 1,25100, this will cancel the bearish view.
Technical Indicator:
DEM (14) - In the middle of the range
Price for Entry short around: 1,24550
SL: 1.25200
Jr. Trader - S. Fuchedzhiev
 Varchev Traders
 Read more:
 GBPBGN: increase in price is more probable from the current levels
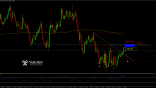 EURGBP: probability for an upcoming downward impulse
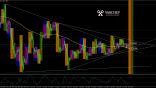 GBPUSD short term sentiment in front of important data at 11:30 (GMT+3)
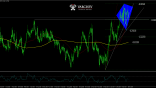 A price below 2.268 can lead to a new decline by the pound
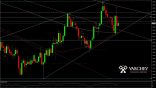 Pound rises after the defeat of May’s Brexit deal
If you think, we can improve that section,
please comment. Your oppinion is imortant for us.

