

- Home
- >
- Stocks Daily Forecasts
- >
- General Motors with new “sell” opportunities

General Motors with new "sell" opportunities

Rating:

GM (General Motors)
Time frame: D1
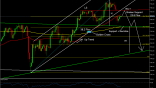
Technical analysis: The chart shows that the stock price is moving in a strong downward trend. On 19.10.18 it recorded a bottom at $ 30.50 from where it headed north. On 06.02.19, the price managed to record the peak of the upward moving, touching the strongest level of Fibonacci resistance at 61.8%. From this level, the price went south again, consolidating between $ 40 and $ 35 for a long time. At the moment, it is back to the diagonal resistance, with the Evening Star formation on the daily chart confirming that the downward movement would had to go on.
Indicators: At this stage, all moving averages play a role of resistance.
RSI and DeM have formed a divergence that supports the "Sell" scenario.
Entry into Deal: From current levels
SL: $ 50
Alternative Scenario: If the price can break the current resistance (the red trend line) and Fibonacci level 61.8, we can see a new appreciation to the next strong resistance zone at the green trend line.

 Trader Milko Zashev
 Read more:


If you think, we can improve that section,
please comment. Your oppinion is imortant for us.

