

- Home
- >
- Stocks Daily Forecasts
- >
- GM: good levels for buy

GM: good levels for buy
Rating:

Date: 25.04.2017
Instrument: General Motors (GM)
Chart: D1
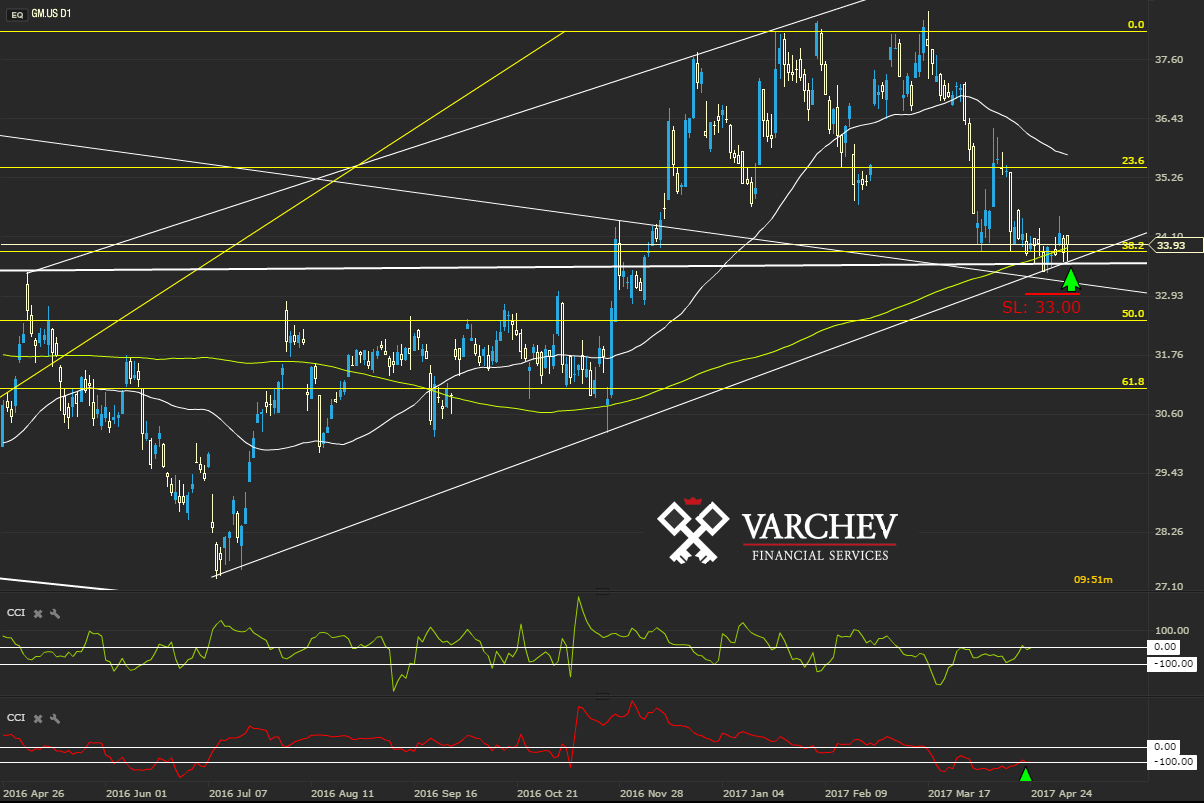
Price in long-term upward trend and make retracement. The levels are suitable for purchase, because the price correct to levels of horizontal support, which matched with diagonal support, Fibonacci ratracement 38.2% and dynamic support level - 200SMA. Fundamentally, the company is performing well, with positive annual financial results for four years. Analysts' expectations for the first quarter of 2017 are positive, with more than 8% growth in the company's revenue expected. The stock price is below the fair value, undervalued by $5.56 (14%).
Price Action: Bullish pin bar at support levels - a positive signal for the price.
Indicators: The CCI(50) crosses -100 from the bottom up - the probable end of the corrective movement.
SL: 33.00
Alternative Scenarios: If the price goes below the horizontal and diagonal support, and it stays there, the positive scenarios will be spoiled and we may see a decline in the asset's price.
Jr Trader Petar Milanov
 Varchev Traders
 Read more:


If you think, we can improve that section,
please comment. Your oppinion is imortant for us.

