

- Home
- >
- Commodities Daily Forecasts
- >
- GOLD: Possible End of correction and new short

GOLD: Possible End of correction and new short
Rating:

GOLD:
Date: 3 November, 2016
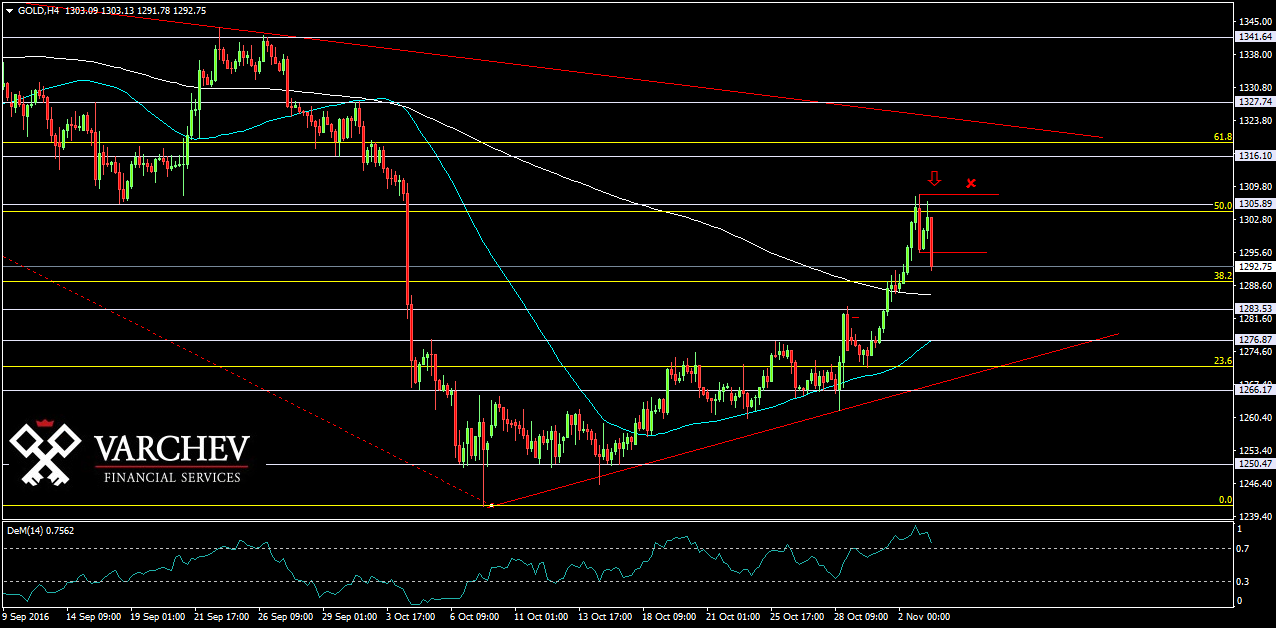
H4 Graph: Long term short, End of correction
The price for gold made a bottom around the $1250, but now as the price reached level of $1305, price stopped and remained below the strong horizontal resistance and Fibo50%.
Price Action: Engulfing Bar on level of horizontal resistance - signal for short

Alternative scenario: If the price goes up and moves above the previous high and above Fibo 50% will cancel this scenario.
Technical Indicator:
DEM (14) - In the overbought zone and turning down for short
Price Entry for short around: $1297
SL: 1310.50
Jr. Trader - S. Fuchedzhiev
 Varchev Traders
RECCOMEND
WAS THIS POST USEFUL FOR YOU?
If you think, we can improve that section,
please comment. Your oppinion is imortant for us.
If you think, we can improve that section,
please comment. Your oppinion is imortant for us.

