

- Home
- >
- Commodities Daily Forecasts
- >
- GOLD: The End of the correction and possible new long at current level with small SL

GOLD: The End of the correction and possible new long at current level with small SL
Rating:

GOLD:
Date: August 8, 2016
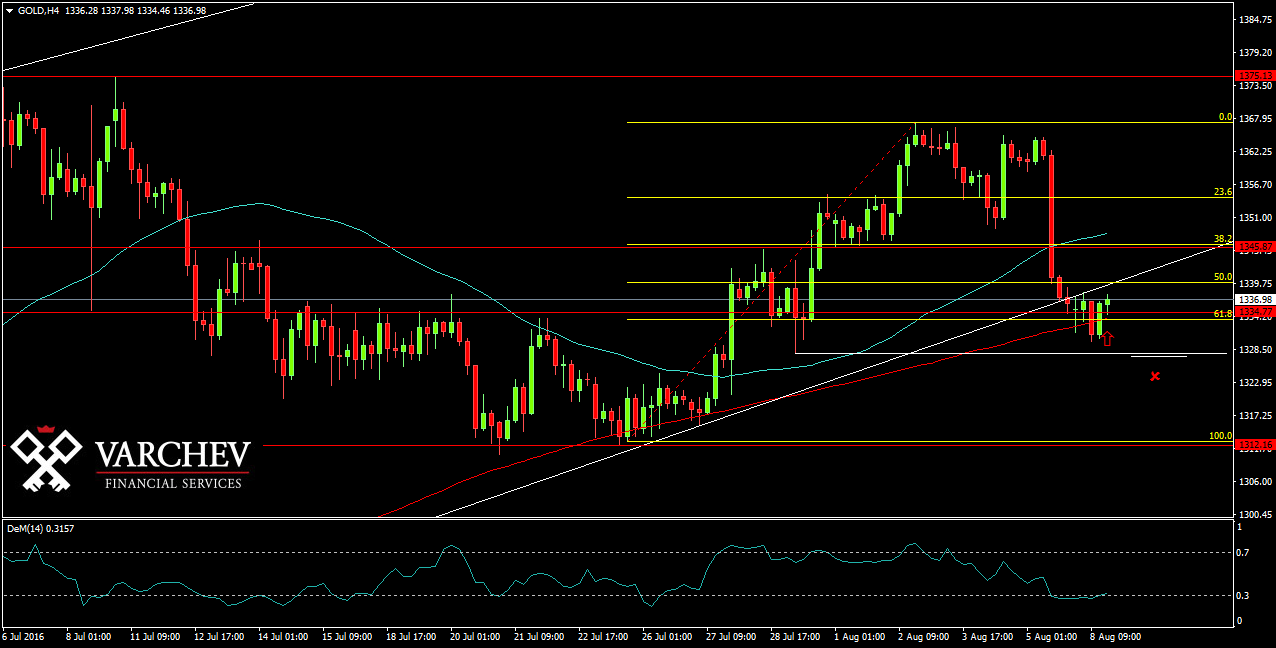
H4 Graph: Long Trend
After reaching $1368,00, the price fell to horizontal support at $1335,00. Here we may see both senarios long or short. However the trend is long. The correction is also coincided with Fib level of 61,8%. There is a possibility for long in the direction of the trend with small SL.
Price Action: Doji bar at level of strong support

Alternative Scenario: If the price moves lower below the Fib 61.8%, again closes below the horizontal support below $1335 and below $1327.30, this might give us a signal for short instead.
DEM (14) - In the oversold zone and turned up for long
Price for Entry long around: 1333,00
SL: 1325.00
Jr. Trader - S. Fuchedzhiev
 Varchev Traders
 Read more:


RECCOMEND
WAS THIS POST USEFUL FOR YOU?
If you think, we can improve that section,
please comment. Your oppinion is imortant for us.
If you think, we can improve that section,
please comment. Your oppinion is imortant for us.

