www.varchev.com

Here is why to look in Europe, when the correction is here

European vs US PB

Rating:

12345
Loading...

Since equity markets around the world enjoy a fairly good start of the year, market players do not accept European assets such as those in the US and Asia. Still, many of the indicators show that Europe has something to show. The RSI of the Euro Stoxx 50 is still in the range between 50 and 60, pointing upwards and indicating that the rally is yet to come. On the other hand, wage growth rates are lower than other developed and emerging economies around the world. This means that the region may be less vulnerable when it is time for correction.

Manufacturing PMI
After years of crisis in production, the European economy is finally showing signs of steady growth. Germany's and the Eurozone's PMI are at 64 and 61 levels, while the US indicator is struggling with the top of 55.

Investment enthusiasm
Looking at investment enthusiasm, many analysts upgraded European companies' profits expectations to the highest level since June 2017. For comparison, world earnings expectations are at record levels.

P/E
Valuation measures also show a remarkable difference between the inertia of US and European stocks. While the SP500 P/E is above 18 levels (last reached in 2002), the Stoxx 600's P/E moves around 15, away from the peak reached in 2015.

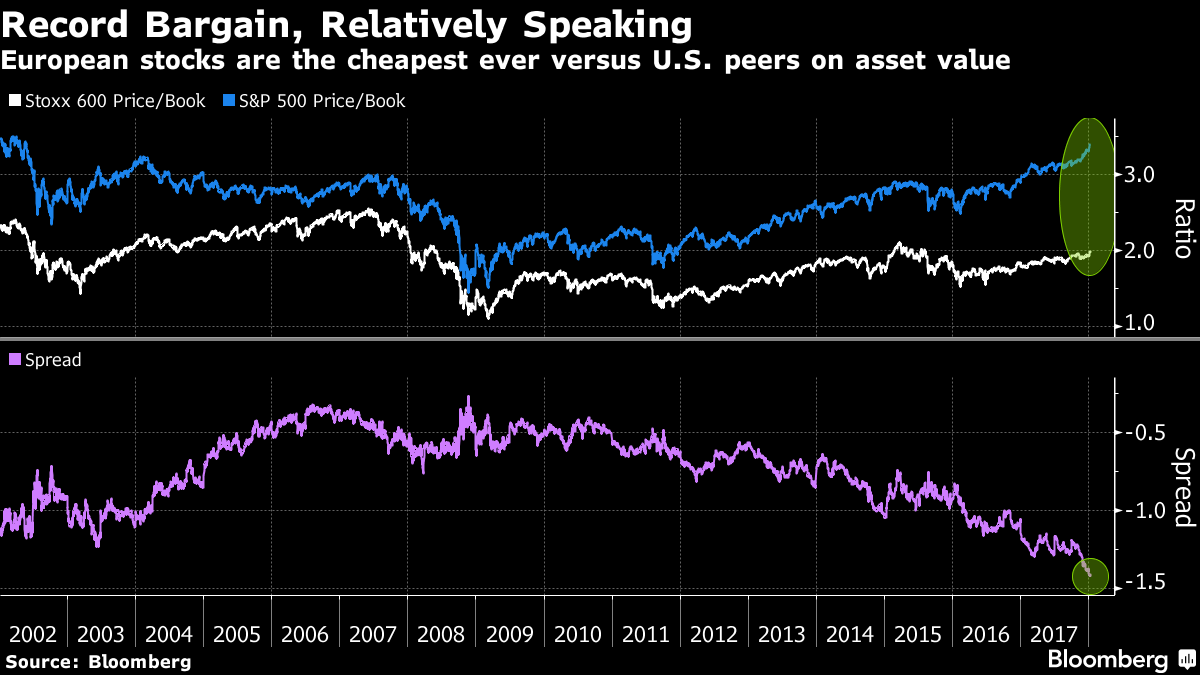
Are the shares in Europe undervalued?
If we take into account one of the most important indicators that tells us whether a share is underestimated, then those in Europe are by no means underestimated - P/B of Stoxx 600 = 2. But in the US, things are even more optimistic , with P/B of SP500 at levels of 3.4.

Source: Bloomberg Pro Terminal

Jr Trader Petar Milanov

Bloomberg: Is Europe a Good Place to Hide Stock Market Correction?


 Varchev Traders

Read more:

RECCOMEND WAS THIS POST USEFUL FOR YOU?
If you think, we can improve that section,
please comment. Your oppinion is imortant for us.
WARNING: Any news, opinions, research, data or other information contained within this website is provided as general market commentary and does not constitute investment or trading advice. Varchev Finance Ltd. expressly disclaims any liability for any lost principal or profits which may arise directly or indirectly from the use of or reliance on such information. Varchev Finance Ltd. may provide information, quotes, references and links to or from other sites and blogs and other sources of economic and market information as an educational service to its clients and prospects and does not endorse the opinions or recommendations of the sites, blogs or other sources of information.
Varchev Finance

London


25 Canada Square, Level 33, office 50, Canary Wharf London, E14 5LQ +44 20 3608 6256

Universal numbers

World Financial Markets - 0700 17 600    Varchev Exchange - 0700 115 44

Varchev Finance Ltd is registered in the FCA (FINANCIAL CONDUCT AUTHORITY) with a passport in the United Kingdom: FCA, United Kingdom - registration number: 494 045, which allows provision of financial services in the United Kingdom.

Varchev Finance Ltd strictly comply with the statutes of the European directive MiFID (Markets in Financial Instruments). targeting increased efficiency, transparency and uniformity of financial instruments.
Varchev Finance Ltd is authorized and regulated by the Financial Supervision Commission - Sofia, Bulgaria: License number RG-03-02-05 / 15.03.2006

The information on this site is not intended for distribution or use by any person in any country or jurisdiction where such distribution or use would be contrary to local law or regulation.


Disclaimer:

CFDs are complex instruments and come with a high risk of losing money rapidly due to leverage. 63,41% of retail investor accounts lose money when trading CFDs with this provider. You should consider whether you understand how CFDs work, and whether you can afford to take the high risk of losing your money.

chat with dealer
chat with dealer
Cookies policy