

- Home
- >
- Stocks Daily Forecasts
- >
- Here’s Why Alibaba, JPMorgan and Qualcomm Should Still Be on Your portfolio

Here's Why Alibaba, JPMorgan and Qualcomm Should Still Be on Your portfolio

Rating:

Alibaba Group Holding
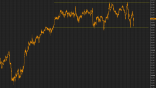
It wasn't all that long ago that shares of e-commerce giant Alibaba Group Holding Ltd. (BABA) were on shaky ground - back in the fall, Alibaba was correcting hard. But since finding their footing in late December, shares have managed to rebound more than 17%, outperforming the S&P 500 by a factor of four. Don't worry if you've missed that recent bullish turn in BABA; shares are signaling a potential second leg higher in February.
Since the last week of January, Alibaba has been forming an ascending triangle pattern, a bullish continuation setup that's formed by horizontal resistance up above shares at $105, and uptrending support to the downside. Basically, as Alibaba pinballs in between those two technically significant price levels, it's been getting squeezed closer and closer to a breakout through that $105 price ceiling. When that move through $105 happens, we've got a brand new buy signal in BABA.
Once that breakout move happens, prudent risk management dictates parking a protective stop on the other side of prior support at $100. If Alibaba backslides below that $100 level, then the ascending triangle is invalidated. Shares are within grabbing distance of a buy signal here - keep a close eye on how Alibaba trades over the next few sessions...

JPMorgan Chase
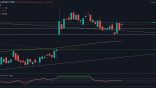
We're seeing the exact same price setup in shares of $329 billion banking giant JPMorgan Chase & Co. (JPM) - the big difference here is that JPMorgan's breakout signal actually already triggered a confirmed buy yesterday. For JPMorgan, the breakout level to watch was $88 resistance. Shares pushed through $88 on Tuesday, and confirmed the move with yesterday's close at $90.59.
What makes that $88 level so important for this stock? It all boils down to buyers and sellers. Price patterns, like this ascending triangle setup, are a good quick way to identify what's going on in the price action, but they're not the ultimate reason shares look attractive here. Instead, the "why" is driven by basic supply and demand for JPMorgan's shares themselves.
The $88 resistance level is a price where there has been an excess of supply of shares; in other words, it's a spot where sellers have previously been more eager to step in and take gains than buyers have been to buy. That's what makes a breakout above $88 so significant - the move means that buyers are finally strong enough to absorb all of the excess supply above that price level. If you decide to be a buyer here, consider placing a stop on the other side of the 50-day moving average.

Qualcomm
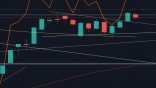
Tech giant Qualcomm (QCOM) has been a hard stock to like in recent months. Year-to-date, Qualcomm is 13% lower than it started, selling off hard back in the middle of January. That's the bad news. The good news is that Qualcomm looks ready to rebound thanks to a classic technical price setup.
Since almost immediately after its big selloff, Qualcomm has been forming a rounding bottom, a bullish reversal pattern that looks just like it sounds. The setup indicates a gradual shift in control of shares from sellers to buyers - and it triggers with a breakout through the resistance level that's identified the top of the pattern, in Qualcomm's case up at $57. Shares ended yesterday within grabbing distance of breakout territory, providing good reason to keep a close eye on Qualcomm's shares as we finish off the week.
Price momentum, measured by 14-day RSI, adds some extra evidence towards a reversal in Qualcomm. Our momentum gauge has made a series of higher lows during this stock's reversal pattern, a bullish bit of confirmation that indicates buyers are stepping back in behind the scenes. Still, price is primary - wait for Qualcomm to push through $57 before you buy it.

Schlumberger Ltd.
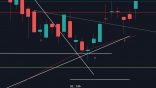
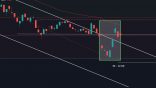
Good news: you don't need to be a technical trading expert to decipher what's happening in shares of oilfield services stock Schlumberger (SLB) . Instead, the price action in this $114 billion energy company is about as simple as it gets. Schlumberger has been in a well-defined uptrend for the last year - and it's a "buy the dips stock" this February.
Schlumberger's uptrend is defined by a pair of parallel trendlines that have corralled most of this stock's price action stretching back to last March. So far, every test of the bottom of the channel at trendline support has provided investors with a low-risk buying opportunity before SLB's next up-leg. And shares are bouncing off of support for an eighth time this month.
Actually waiting for that bounce is important for two key reasons: it's the spot where shares have the most room to move up before they hit resistance, and it's the spot where the risk is the least (because shares have the least room to move lower before the channel breaks, invalidating the upside trade). Remember, all trend lines do eventually break, but by actually waiting for the bounce to happen first, you're ensuring Schlumberger can actually still catch a bid along that line before you put your money on shares.

Telefonica SA
Last on our list of large-cap breakout trades is Spanish telco Telefonica SA (TEF) . This $50 billion telecom stock has mostly been churning sideways for the last year, doing nothing despite a wide-range that shares have swung within. Interestingly enough, that sideways grind is actually what's setting Telefonica up for an up-move in February. Here's how to trade it...
Telefonica is currently forming a long-term inverse head and shoulders pattern, a classic reversal setup that signals exhaustion among sellers. Telefonica's price pattern is formed by two swing lows that bottom out at approximately the same level (the shoulders), separated by a lower low (the head). The buy signal gets triggered on a move through TEF's neckline at $9.80. Shares ended Wednesday's session just a couple of points above that $9.80 level, but the breakout doesn't get confirmed unless TEF can stay above that price level today.
The deep low in Telefonica's price pattern actually sets this stock up for a potentially long-lasting push higher from here. While prior resistance at $10.40 could present a pocket of selling on the way up, Telefonica's pattern implies a price target of $11.40 if the breakout gets confirmed. If that happens, it makes sense to put a stop loss on the other side of the 200-day moving average; if TEF falls below the 200-day, you don't want to own it anymore.

 Varchev Traders
 Read more:
If you think, we can improve that section,
please comment. Your oppinion is imortant for us.

