

- Home
- >
- Daily Accents
- >
- How do we find the bottom under market instability?

How do we find the bottom under market instability?
Rating:

How low can the stocks fall to reach levels where investors feel confident enough to buy? This is the issue that harms all participants.
One after the other, the levels that were potential for rebounding were drilled from the beginning of October. Even at times to try, investors simply can not decide whether the stocks are cheap enough at the moment. There are many factors to prevent this issue from being explored: the US-China trade war, interest rates and fears of recession. At one point, the economy will slow down. We will have higher interest rates when this happens and this will injure the right market estimates.
So where is the bottom? Below are some points of view that address the issue on various criteria such as market assessments, corporate earnings, monetary policy and economic fundamentals. Some show that the market down to the bottom has a long way to go, and others that the stock is "screaming" for purchases.
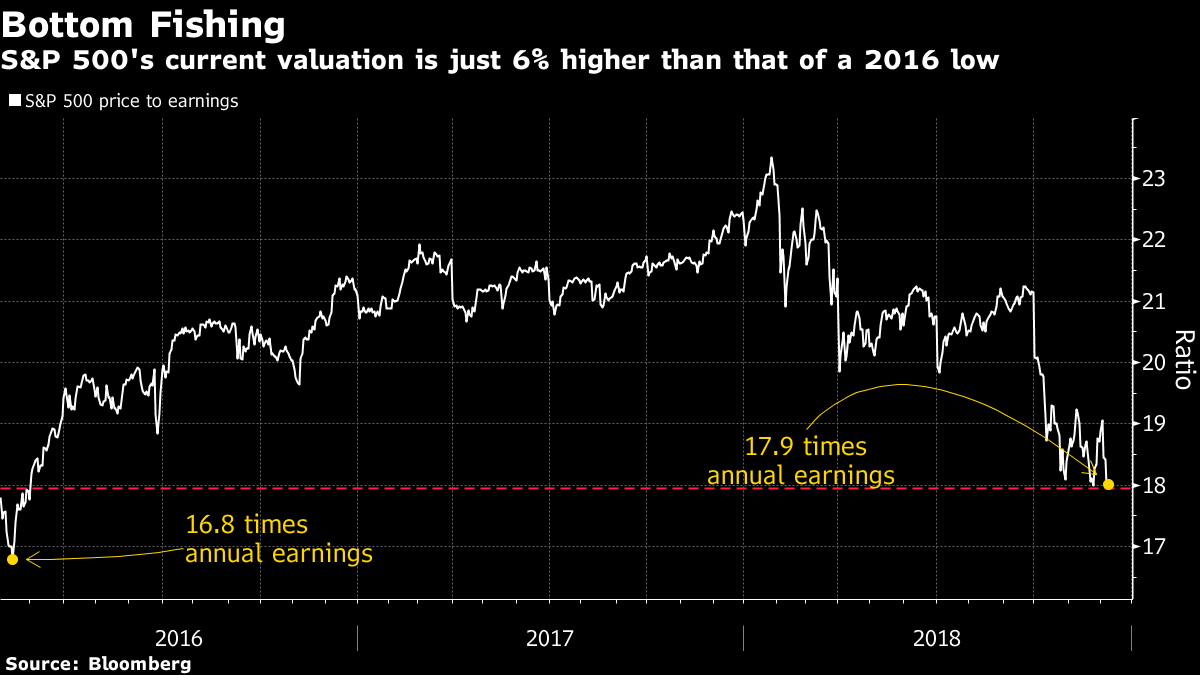
The 2016 case
Going to the simplest measure, the P / E ratio at the bottom of the last sellout, the end may come soon. Early in 2016, worries about shrinking profits and weaker growth outside the United States pushed the S & P500 down 10% down, and the market score was 6% lower. Then, a lot of stocks were at very cheap and attractive levels, and they were hurriedly bought, causing rally on the markets by 15% over the next four months.

The FED Model
The amount of bond yields is a problem for investors and traders to sell stocks at present. Not only that higher interest rates raise the cost of maintaining the business operations of the companies, but also convert shares less attractive asset.
Let's see 2015 The year in which the Fed began its cycle of raising interest rates and the cast fear then this policy took shares in the area of correction. The yield on the S & P500 was 3.9 percentage points above the yield on 10 - year government bonds. Now this spread is 2.7 points.

The wider gap means that stocks are cheaper than bonds and if we have such a big difference again, it will mean a 17% drop in the S & P500.
Growth of the economy
The stock market does not relate solely to the economy. But lately, it is quite difficult to escape the feeling that investors, with all their wisdom, look with a sense of negativity for economic growth. Too negative, according to Goldman Sachs.

The return of the S & P500 for the past 12 months has been negative for the first time since 2016. Something that historically corresponds to the value of 50 of the Institute for Supply Management's Manufacturing Index or, in other words, a moment of stagnation. In contrast, however, the same index last month reported a value of 59.3, which is a sign of healthy expansion.
PEG ratio
Using an evaluation model that incorporates prices and profit growth, it emerges that stocks are actually rarely sought. This is the so-called. PEG ratio, if you believe the analysts' forecasts are next year's profits, it's 1, which means that the market P / E and profit growth are the same. PEG has been lower since 1990 since the US debt crisis in 2011 and the financial crisis in 2008.

But you would certainly agree that the recent "slaughter" of the markets is proof that investors do not believe the next year's forecasts. However, according to many, this skepticism is already appreciated.
Source: Bloomberg Finance L.P.
Graphs: Used with permission of Bloomberg Finance L.P.
 Trader Martin Nikolov
 Read more:
 Risk off after the escalation in the Middle East, markets are recovering in a period of calm
 The macroeconomic events for today’s trading calendar
 The US government has confirmed the attacks, Trump is calling an emergency staff meeting
 Has the war between Iran and the US started?
 US markets remain under pressure, traders await Iran’s response
If you think, we can improve that section,
please comment. Your oppinion is imortant for us.

