

- Home
- >
- Trading University
- >
- How do we trade EUR / JPY in a range

How do we trade EUR / JPY in a range
Rating:

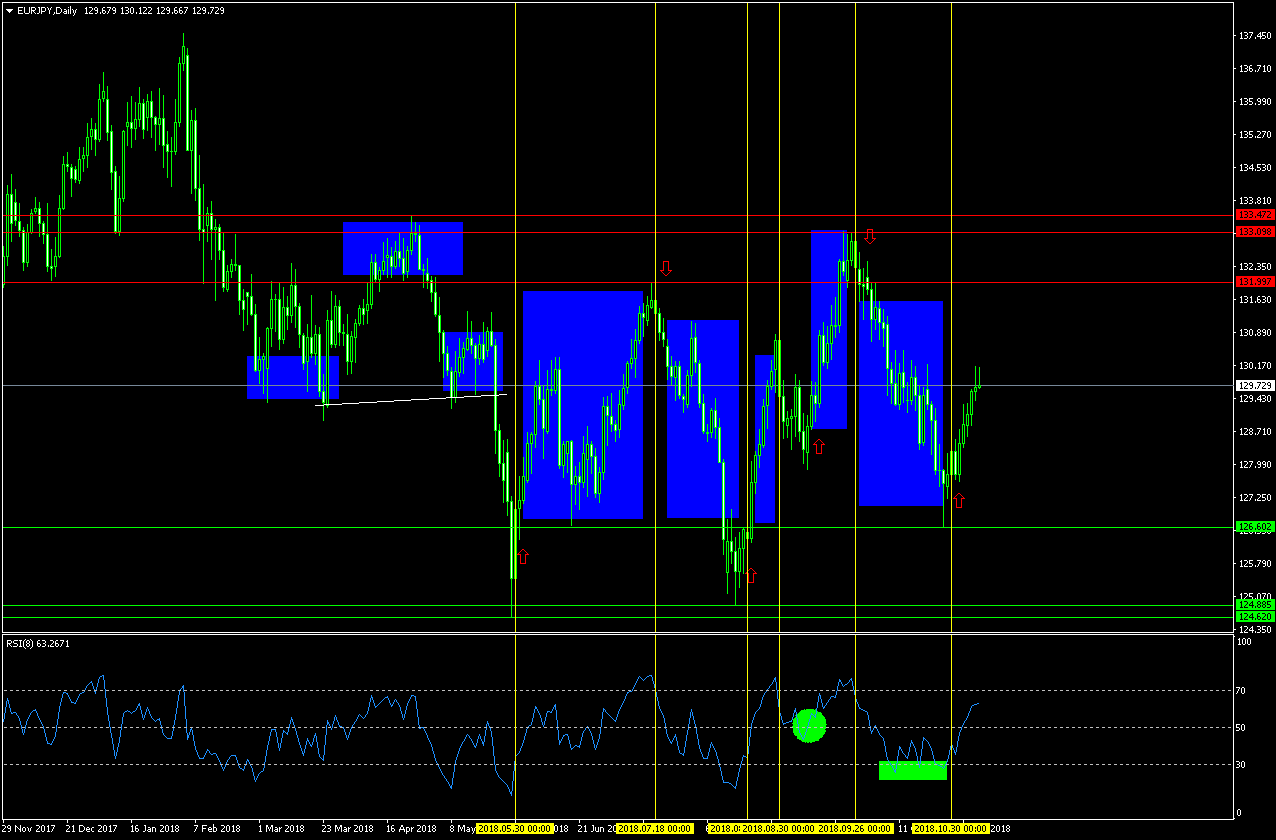
Here we'll show you an easy strategy for trading under consolidation. What we will look at is EUR / JPY on a daily chart with an RSI indicator with period 8.
Consolidation starts after a trend - confirming technical head and shoulder configuration between March 1 and May 23, where the price breaks the neckline and the downward movement continues with great momentum. The price reaches the bottom on May 29, where in zone 124.620 - 124.885 where we have a strong pull of the candle with a big tail and the next candle from May 30th we have a strong bullish movement and intersection of RSI in the resold zone above 30. Here we can look for our first entry with a long position and the movement not only performs 100% correction of the movement of the head and shoulders but also closes over the levels of the neckline. We have an adjustment, but RSI continues to indicate that the price is neither redeemed nor resold. Here we can also observe the extra level 50, which will confirm the force of the movement. Holding the position until the next signal on July 18, we can close it to +513 pips. The previous day we have a pin bar and an RSI signal with a crossing below level 70 in the redeemed zone. We mark level 131.997.
We sell the new signal where we see a new signal closing and opening a long position on August 20th. We close the short position of a good profit. The open new long position we hold until we notice that RSI is turning again in the redeemed zone and the August 30 candle is a bearish swallow. Here we can close the plus. The price really turns down and we will have reason to sell. RSI passes below the extra level of 50. Then it goes back up, which tells us it was a correction. Here we can close if we have sold and find a long position when we cross the RSI again above level 50. on September 26 we have a signal to sell and close our long position, which brings us profit. Selling and with the fall in price we see that RSI makes 3 signals that it's resold but none of them goes above level 50 and we have no action action to confirm this. Already on October 30, we have this signal after a dodge on October 25th, which is the first hint and then a pin bar the next day. When crossing RSI in the resale zone above 30 we can buy. If we have done so, we need to maintain a positive current balance.
Entrance conditions:
BUY: When RSI crosses level 30 from bottom to top, we have a buy signal. The price is in a oversold zone.

SELL: When RSI crosses level 70 from top to bottom, we have a sales signal. The price is in a overbought area.

We can use the extra level 50, which suggests that when RSI crosses it from top to bottom, we have the ability to get a correction and invert the indicator above 50, the motion continues according to the initial signal. As we can trace the graph we have one more call, one for sale, and one that is valid until now, and if we have entered the signal we will now be a very good plus.
 Trader Martin Nikolov
 Read more:
If you think, we can improve that section,
please comment. Your oppinion is imortant for us.

