

- Home
- >
- Managing risk
- >
- How to calculate the size of our deals

How to calculate the size of our deals
Rating:

Position sizing is an often overlooked variable when it comes to strategizing your trades. There are different ways to decide how big your positions should be and here we look at a unique approach to size your positions using volatility.
First, let’s agree that always trading 100 shares, or one futures contract, isn’t as good as varying your position size based on price volatility. If you don’t agree, my first example will show why it’s a problem. Until then, I’m going to assume that we’ll use volatility. When markets are quiet, positions will be larger; when they are volatile, positions will be smaller. The key here is: How big and how small?
The principle behind correct position sizing is called volatility parity, that is, you equalize the volatility of each trade, which in effect equalizes the risk, more or less. There are more sophisticated ways to equalize risk, but volatility parity is much simpler and gets you 90% of the solution.
By equalizing the risk of each trade, you give each trade an equal opportunity to affect the results. From that you can conclude you’ve maximized diversification. If you concentrate your investment in a few markets and trade larger positions in terms of risk,
you are counting on those trades being better. If you knew that, you would only take those trades and skip all the others.
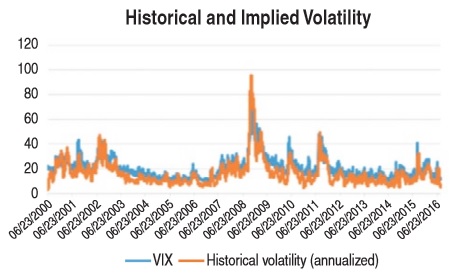
Volatility is like a volcano—quiet for long periods, and then violent eruptions. To use volatility successfully, traders need to know which one—historical (HV) or implied (IV)—is best.
Historical volatility is measured from actual prices, while implied volatility (also tracked as the VIX index) comes from options pricing. I would like to think that IV would be more accurate because it represents what traders are willing to pay today rather than the lagging calculation represented by historical prices.

The chart in Figure 1 compares the long-term historical and implied volatility (on the left) and 2008 on the right. The bigger picture makes it appear that both methods produce close to the same values, but a closer look at 2008 shows the differences. Historical volatility continues to increase after implied volatility has flattened.
If we use one share or one futures contract for each trade, then those markets with higher prices and/or more volatility will overwhelm the performance of other markets with low volatility. If we’re trading futures, crude oil will always have larger gains and losses per trade than eurodollars.
To test will apply a 120 period moving-average, so we can monitor changes in price due to various reasons.
We can calculate the position in several ways. Assume that we can invest $ 10 000.
100 shares for each transaction. This allows us to open positions greater than $ 10 000 when the price is over the 120 period MA
Size by price - divide the investment of $ 10 000 at the current stock price, this will allow us exposure is always $ 10 000.
Using CBOE Volatility Index (VIX), implied volatility of 70% will be interpreted, with 30% value of the position when volatilnsota increases, the size of the position is smaller.
If the value of VIX 100% the size of the position becomes 0.
 Varchev Traders
 Read more:
 The Amateur VS The Professional; The Difference is in The Mind
 A story of a trader: ‘Trading can take over your life – but only if you let it’
 How to Filter Good & Bad Price Action Entry Signals
 The smartest way to invest your first $1000
 Should S&P500 be afraid from Friday 13th what the statistics look like
If you think, we can improve that section,
please comment. Your oppinion is imortant for us.

