

- Home
- >
- Daily Accents
- >
- How to predict the next bear market in 6 graphs

How to predict the next bear market in 6 graphs

Rating:

Each market leaves its traces, and we can see if any long-lasting bullish rally is coming to an end.
Nine years, eight months, two weeks, and two days - the longer this bullish market is going on, and investors are beginning to wonder whether the bears are no longer on the horizon.
The S & P500 is up 291% of the 2009 boom market. Stock prices have risen steadily, driven by profits growth and good reporting. Investors also tended to pay higher premiums for these profits, which is observed in the price-earnings ration.
While there is not one indicator that predicts market twists, analysts and investors can help with six things to observe in an attempt to predict the next bear market, typically characterized by a 20% drop from the previous peak.
Perhaps we have already gone this way. The S & P500 is down 9.76% of its all-time-high, reaching 20 September 2018.

1.Spreads of high yield bonds
What does this mean
This is a measure of what more risky companies pay to borrow against what the government pays. These spreads in history usually give early signals of upcoming economic shocks and earlier than other tools. When spreads narrow down, investors are expecting even the weakest companies to do well. When they expand, however, these companies have more difficult access to loans, which reduces profits and signals investors that there may even be closures to such companies.
What to Look For
A steady upward trend in bond yields and narrow spreads were accompanying the last two bullish markets and preceded their peaks. This was a signal to investors, who began to worry about whether risky companies would succeed in paying their debts.

"It tells me if the companies with the biggest stresses have cash to pay for their debts, and if they do not have it, it is a signal that there will be problems for them, and debt markets are the first to suggest." - Alicia Levine, chief market strategist at BNY Mellon Investment Management
2. Changes in yield on government securities
What does this mean
The yield curve on government securities is the most closely followed indicator of the stock market status, measuring what interest is paid on debt on different maturities. When the economy is strong, yield on long-term government securities is usually higher than short-term debt, which affects confidence in the long-term economic outlook. When yield levels turn and short-term outperform long-term ones, it is a sign that investors are worried that inflation and growth will be lower. High interest rate on short-term debt also negatively affects the business and purchasing power of consumers, which slows down the economy and puts pressure on corporate profits.
What to look for
Investors often overtake recessions and bear markets. This indicator had not changed its direction before the bear market in 1987, but it turned before the bears captured the market in 1980, 2000 and 2007. Investors are still arguing though whether the change in yield can really signal for bear market or interest rates are simply distorted by years of global monetary policy that has kept long-term debt low.

"This is an extremely useful tool for predicting the peak in stock markets." - Jeffrey Keintop, investment strategist at Charles Schwab
3. Activity of companies in relation to takeovers and mergers
What does this mean for the markets?
The activity of the entire range of mergers and acquisitions between companies measured in US dollars.
What to watch
When we have a high activity in the deals between companies, we have a signal that the end of the bullish market is ahead. A jump in the mergers signaled that the mood of the companies has become extremely optimistic - or that companies see this as the only move to growth in a slowdown in the economy. Mergers and acquisitions peak in 200 and 2007, shortly after the stock markets reach their peak in a state of extreme risk. The more recent peaks in this activity were false signals, although a sharp jump in 2015 was followed by a stock-correction that did not turn into a bear market.

"Enthusiasm for deals and high corporate activity reflects broader economic optimism and coincides with booms in stock markets and economic expansion." However, history shows that these M & A waves are a late, cyclical indicator, and their decline usually predicts the end of one business cycle ". - Abi Oladimeji, Chief Investment Strategist at Thomas Miller Investment
4. Weekly jobless claims
Their importance
This is the number of people for the week who filled out a claim for unemployment benefit. Market participants view these figures as the main and leading indicator of the US labor market, the health of the economy, and the ability of companies to generate profits.
What to Look For
When unemployment rises, consumers spend less money, which reduces companies' profits. Analysts suggest an increase in these requests after each stability period. If this happens at a time of weakness, as shown by the US Labor Market Monthly Survey, it is a pretty strong sign that there are problems in the economy.

"Aid applications are obviously a leading indicator of a recession, starting to shine in red when they begin to grow on a four-week basis, usually after a period of decline and then gradually to increase. labor market". - Bob Baur - Chief Economic Analyst at the Principal Financial Group
5. Investor Confidence
Its meaning
T. The AAII poll is a barometer for US mood investors who are asked to make an estimate of the direction of the S & P500 for the next six months.
What to watch
Here we are looking for extreme peaks of investor bullish sentiment. When investors become overly optimistic, they usually start spending too much and relying on their savings. This "damping" is getting smaller, which protects the markets, which allows us to have more inertia at times of sale. This indicator worked well before the Dot-com bubble burst and had its extreme point before the 2011 and 2018 sales.

"When we have strong confidence in the participants, they start to abuse their money, creating a surplus that bears can" eat. "- Jim Paulsen, chief investment strategist at Leuthold Group
6. What does the market think?
What?
Accept it like this: The market "anticipates" what market participants think and can assume a bear market. The measurement is made by the expiration of six-month maturity options that are likely to have a 20% or more decline in the S & P500. 20%, because that implies that we are already in the bear market in this territory. Economists from the Federal Reserve in Minapolis have indicators useful in filtering market expectations for future prices, but they actually measure what investors are thinking right now, as accurate as predicting indicators.
What to watch here
This is a relatively new indicator. On the chart, we have a spike in the past financial crisis and we are seeing other peaks in episodic market turmoil such as the fears of hard landing of the Chinese economy in 2016.

Source: The Wall Street Journal
 Trader Martin Nikolov
 Read more:
 Risk off after the escalation in the Middle East, markets are recovering in a period of calm
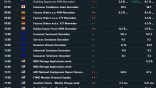 The macroeconomic events for today’s trading calendar
 The US government has confirmed the attacks, Trump is calling an emergency staff meeting
 Has the war between Iran and the US started?
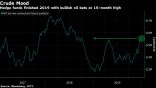 US markets remain under pressure, traders await Iran’s response
If you think, we can improve that section,
please comment. Your oppinion is imortant for us.

