- Home
- >
- Technical Analysis Education
- >
- How to recognize and trade Price Action signals

How to recognize and trade Price Action signals

With knowledge of price action, traders can perform a wide range of technical analysis functions without the necessity of any indicators. Perhaps more importantly, price action can assist traders with the management of risk; whether that management is setting up good risk-reward ratios on potential setups, or effectively managing positions after the trade is opened.
Trend Analysis
The first area of analysis that traders will often want to focus on is diagnosing the trend (or lack thereof), to see where any perceivable biases may exist or how sentiment is playing out at the time.
n Price Action Introduction we looked at how traders can notice higher-highs and higher-lows in currency pairs to denote up-trends; or lower-lows, and lower-highs to qualify down-trends. The chart below will illustrate in more detail:

Entering Trades
After the trend has been analyzed, and the Price Action trader has an idea for sentiment on the chart, and trend in the currency pair – it’s time to look for trades.
In Price Action Pin Bars, we examined one of the more popular candlestick setups available, which traders will commonly call a ‘Pin Bar.’

Here is how traders can take advantage of the so called "Fake Pin Bars". These are candles that show long wicks that don’t quite ‘stick out’ from price action. This is where trend analysis can greatly assist in the setting of initial risk (stops and limits). An example for entry at "false pin bar":
eriods of congestion or consolidation can also be used by traders utilizing price action. In Trading Double-Spikes, we looked at the ‘double bottom’ or ‘double top’ formation that is popular across markets.
We looked at the Double-Spike breakout for instances in which traders are anticipating that the support (or resistance) that has twice rebuked price may get broken with strength. The Double-Spike breakout is plotted below:
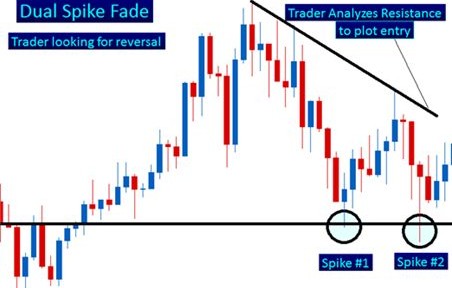
And for situations in which traders are anticipating support or resistance continuing to be respected, the Double-Spike Fade may be more accommodating:
On the topic of congestion, another very popular setup that we discussed was Trading Price Action Triangles.
While there are different types of triangles, most traders look to trade these periods by anticipating a breakout. Below is the ‘Descending Triangle,’ in which price has respected a horizontal support level while offering a down-ward sloping trend-line. Related is the ascending triangle that is highlighted with an upward sloping trend-line. In both instances, traders are often looking to play breakouts of the horizontal support or resistance level.
If no horizontal support or resistance exists, traders may be looking at a ‘symmetrical triangle,’ which adds an element of complication since there are no horizontal levels with which to look to play breakouts. An example for "symmetrical triangle":
 Varchev Traders
 If you think, we can improve that section,
please comment. Your oppinion is imortant for us.


