

- Home
- >
- Trading University
- >
- Investor Strategy for Gold Trading

Investor Strategy for Gold Trading

Rating:

We’re going to reveal some gold trading secrets used by professional traders to invest in Gold.
There is a correlation between how gold moves and the gold seasonal pattern.
There are certain times of the year when gold is stronger and some other times of the year when gold is traditionally weaker. Wouldn’t it be great to know in advance when gold has a higher probability to rise or higher likelihood to fall?
The natural phenomena have the intriguing trait that they repeat themselves during the same parts of the year. Snow usually falls in winter while sunshine during the summer. On average these tendencies persist. And this is precisely what seasonality is.

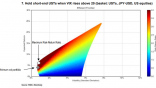
Gold price, according to its seasonal cycle, has the tendency to go up in the first quarter of the year as well as in the last months of the year. September would be one of the best trading months for the gold price if you bought it.
We have to keep in mind these are just general indicators. The gold seasonal cycles will only give you the tendency of Gold to bottom or top or rally or fall, at a particular point in time.
The below gold chart puts into perspective the seasonal pattern:

The Gold seasonal cycle is crucial because it’s one of the tools that highlight what the smart money is doing.
Before outlining the Gold strategy rules let’s look at what indicators we need to trade successfully this method.
The only indicators you need are the following:
Fibonacci Retracements are a very popular technical indicator based on the key mathematical numbers identified by Leonardo Fibonacci many centuries ago. These mathematical numbers can offer us significant areas of support and resistance.
Step #1: Buy Gold in the trading months with above average return
The first step is to make sure that you’re buying the months that Gold price has the tendency to rally. According to the gold seasonal pattern the best months to buy gold and the best way to buy gold is in January, February, August, September, November and December.
The number one thing these months have in common is that the gold price return is above average during these trading months.
The seasonal price pattern for gold tends to repeat itself quite often because smart money tends to do the same thing over and over again.
Now that we’ve spotted the influence of seasonality on gold price is time to move to the second trading rule.
Step #2: Wait until Gold retrace to the 0.618 Fibonacci Retracement of the previous market swing
It’s not enough to identify the seasonal pattern and to focus just on that. We believe there should be at least one more element you should include in your trading strategy
When you combine both the seasonal pattern and the Fibonacci retracement indicator, this alerts you that a potential Gold buying opportunity lies ahead
This is a robust trading system, but you have to be flexible with the rules and try to fit it in the overall price action as well.

In our proposed gold trade example we can see that Gold has traded below the 0.618 Fibonacci retracement of the previous market swing. But this action happened during December and we can see that gold price started picking up right from the start of January 2018.
Step #3: Buy at support or on the way up as we break above resistance
Remember, when dealing with this type of trading principle it’s all about flexibility.
For our gold buying strategy, we’re proposing a very simple technique. If the price of Gold at the time of your analysis is trading at support you can go ahead and buy it.
However, if the market starts rallying before we enter into January, wait until we break above previous resistance to buy gold.

As you can see the actual gold price followed its seasonality cycle. This means that our seasonal analysis was correct
The next important thing we need to establish for our Gold strategy is where to place our protective stop loss.
Step #4: Place protective Stop Loss below last swing low
If gold is following its seasonal pattern than new highs should be seen not new lows.
If gold break to new low, this will invalidate our trade and we want to be out of this position.
In this regard, when we trade gold with this strategy, we place our protective stop loss below last swing low.

Now that you know where to hide your stop loss, let’s define our take profit strategy.
Step #5: Take Profits before the end of February and trail your SL below each swing low
If gold has followed its seasonal pattern in the first months, it’s wise to expect it to continue following the seasonal cycle moving forward. According to gold seasonal pattern March is one of the worst trading months for gold, so it’s best to liquidate your gold position and enjoy your profits.

If you had used this simple gold trading strategy, you would have anticipated the new Gold trend and made some big profits from it.
In two months you’ve made a healthy profit as gold price went from $1265 to $1366.
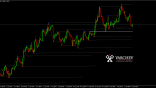
You can also find sell signals using the exact opposite trading rules. The way it works for a SELL trade can be seen in the example below:

Charts: Used with permission of Bloomberg Finance L.P.
 Trader Aleksandar Kumanov
 Read more:


If you think, we can improve that section,
please comment. Your oppinion is imortant for us.

