

- Home
- >
- Stocks Daily Forecasts
- >
- Is it buy, sell or hold time as the market hits new highs?

Is it buy, sell or hold time as the market hits new highs?
Rating:

1. The chart of S&P 500 shows a breakout through the resistance at 2136.52. But we don't know if it will be stable although the possibility for a new upward impulse is high:
-Based on traditional technical analysis, a measured move up will extend the new range by the same amount as the prior range
-The target of the measured move is 2448 as shown on the chart; this is about a 15% projected up-move.

-Previous breakthroughs at record levels were short, than the price has returned below the peaks, made a correction and again reached the all time highs. This breakthrough is, however, sudden after a strong correction, breaking several resistances simultaneously.
2. Earning trough
In the long run, earnings growth is the single biggest determinate of a market rise. Earnings have been declining for several quarters. This quarter has seen the fewest pre-announcements in recent quarters beacause the focus of the market is on UK. If this happens, it is reasonable to believe that markets will remain in bull territory If earnings are worse than expected, the index will go under the levels of resistance.
3. Economic indicators
Economic indicators show uncertainty, insignificant data keeps the price levels in range, which does not support the breach of the resistance level.
4. Sentiment
Sentiment at the present time is negative. Paradoxically, this is bullish for the market. Negative sentiment means that there are many market participants who are underinvested, and there is a lot of cash around. If the market continues to rise, many money managers who have to meet or beat their benchmarks will end up holding their noses and buying leading to a further rise in the market.
5. Valuation
The stock market at present trades at a high valuation and for this reason does not merit further rise.
On the flip side, in relative terms compared to bonds, the present stock market valuation is down-right dirt cheap.
6. Geopolitics and central banks
There are many geopolitical risks ahead including the U. S. election, Brexit, South China Sea, currencies, and central banks' unorthodox policies. In totality, these risks lead to a prudent conclusion of taking a bearish stance. Despite all, at the moment everything is refracted trough the Central Banks. Although low income of companies, indexes continue to rise, why ? Because Central banks keep the interest rates low which rises share prices. Analyzers believe that low interest rates will stimulate the economy and later it will register better data. Lower interest rates reduce the value of the currency, which increases investments and some of them go to shares. So when there is no expectations of tightening monetary policies, the probability for long is high.
7. What do we do now ?
There are many factors other than the above that go into making our market calls. Става ясно, че фундамента е против нов силен импулс нагоре, докато техническия анализ дава голяма вероятност за long. On the other hand short-term movement is still long, indicators are in strongly positive territory in overbought market. While the price remains above 2136, long is probable and with every new correction will be used for sell. If the price reaches below 2136, this will indicate that the breakthrough is unstable.
Therefore we can trade short-term long at every slight correction at H1 chart while the price remains above 2136 but it is dangerous for investment and purchases at the moment. Remember - long trend only after correction.
 Varchev Traders
 Read more:
 US – Iran – Iraq tension remain the main driver of the stock market today
 How top market players on Wall St think 2020 will look like on financial markets
 Money Flow before the start of the new trading week
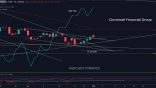 Cincinnati Financial Corporation (CINF.US) -Opportunity for long positions
 Asia stocks gain as Fed signals no rate cuts in 2020
If you think, we can improve that section,
please comment. Your oppinion is imortant for us.

