

- Home
- >
- Daily Accents
- >
- Is there a bubble in US economy ?

Is there a bubble in US economy ?
Rating:

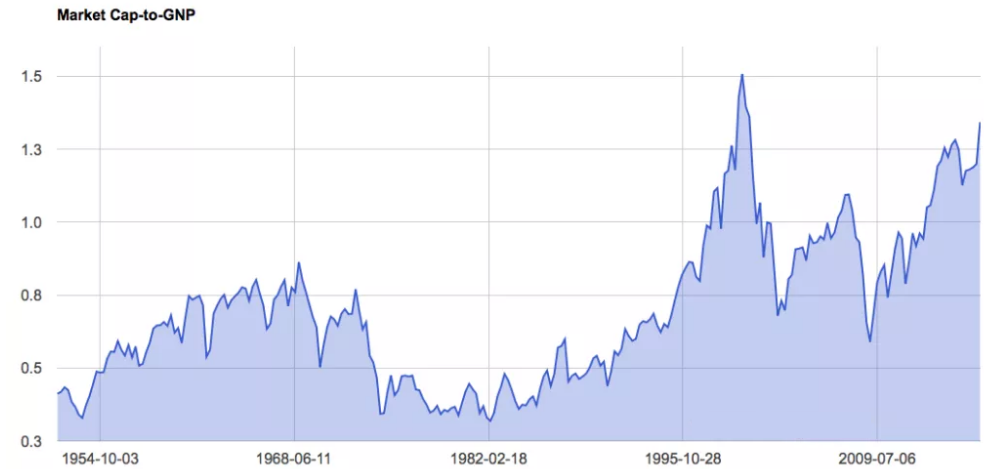
On a macro basis, quantification doesn’t have to be complicated at all. Below is a chart, starting almost 80 years ago and really quite fundamental in what it says. The chart shows the market value of all publicly traded securities as a percentage of the country’s business–that is, as a percentage of GNP. The ratio has certain limitations in telling you what you need to know. Still, it is probably the best single measure of where valuations stand at any given moment. And as you can see, nearly two years ago the ratio rose to an unprecedented level. That should have been a very strong warning signal.
 Varchev Traders
 Read more:
 And for all the bounty hunters: Iran offers $80m for the head of Donald Trump
 US service member and 2 US Defense Dept contractors killed in Kenya attack
 Iranian Quds leader Qasem Soleimani has been killed – how are markets reacting
 A calm end of an otherwise loud 2019
 Old but Gold – Top 5 posts of Varchev Finance
RECCOMEND
WAS THIS POST USEFUL FOR YOU?
If you think, we can improve that section,
please comment. Your oppinion is imortant for us.
If you think, we can improve that section,
please comment. Your oppinion is imortant for us.

