

- Home
- >
- Opportunities for profit today
- >
- Is there a new collapse of the RTS and the ruble after the US sanctions against Russia?

Is there a new collapse of the RTS and the ruble after the US sanctions against Russia?
Rating:

The United States has announced that it intends to impose new economic sanctions against Russia after finding that Moscow is behind the raid with the Novichok nervous agent against former Russian spy Sergei Scripal.
Following the poisoning of former Russian double agent and his daughter Julia Scripal in Salisbury in March, "the United States has found that the Russian government has used chemical or biological weapons in violation of international law or has used lethal chemical or biological weapons against its compatriots," State Department spokesman Heather Nauert. Under the US Chemical Weapons Act, this conclusion leads to the imposition of economic sanctions, which are expected to take effect at the end of the month - on or around August 22, the spokesman added without specifying what the sanctions would be.
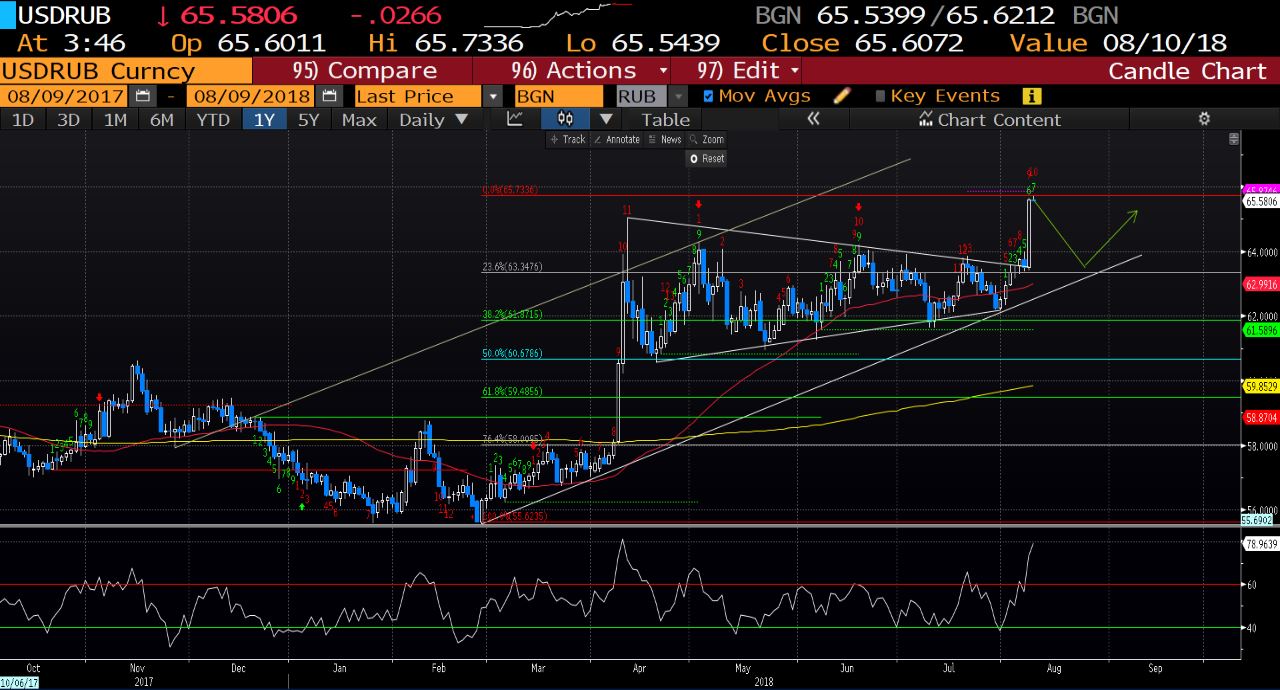
Let's look at the ruble against the USD and the Russian stock index RTS
USD/RUB - D1 (Main Chart)
After the breakthrough of the long-term downward diagonal, the pair formed a triangle formation which, since the announcement of the US sanctions to Russia, was activated in the upward direction. Entry from the current levels will be at risk, but a downward correction to the basic ascending diagonal will give us reason to buy. I expect such a move as the sanctions that will be imposed against Russia are not yet clear and whether only the US will impose such. Short-term correction is also supported by Sequential, which is the 13th highest and DeMarker is at a record high level.
RTS - D1

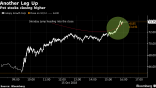
When Trump plunged the Russian capital market by more than 12% in March, the prospects for Russian companies today are no less bad.
How Trump led the Russian capital market to collapse
A quick technical look shows that after the Crash-a in March the Russian index formed a broad consolidation, and is now about to register a breakthrough in the downward direction. In support of the short is also the breakthrough of the inner diagonal, as well as the location of the indicators. Sequential is counting 5th below, while DeMarker is yet to enter a surplus sales area - probably the downward impulse will continue. 50 and 200SMA remain in place.
Source: Bloomberg
Chart: Used with permission of Bloomberg Finance L.P.
 Trader Petar Milanov
 Read more:
 Legalizing cannabis in Canada is getting closer! Here are the winners
 EM-Bulls take advantage! Here are the most promising sectors
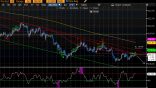 Japan and China on focus during the Asian session, where is the profit today
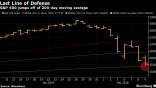 SP500 has reached the last level of support, should we expect a rebound?
 What will we do if we apply the “Buy The Dip” after correcting the indexes
If you think, we can improve that section,
please comment. Your oppinion is imortant for us.

