

- Home
- >
- Daily Accents
- >
- Is trading getting harder

Is trading getting harder
Rating:

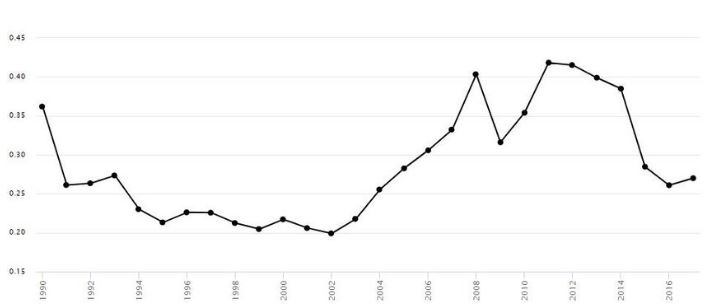
Has making money by trading stocks the last several years become harder? Have you heard that once a trading setup becomes popular it stops working? Perhaps mental roadblocks have impeded your performance or perhaps trading has become more difficult. Let's find out. To answer the first question, look at the performance of chart patterns over almost three decades. For patterns with upward breakouts, measure the average gain from the breakout price to the ultimate high. The ultimate high is the highest peak before price tumbles at least 20% or it is the highest price before the stock closed below the bottom of the pattern. Choose 20% because a drop of 20% from a peak is often used to determine a bear market. Consider these trades to be perfect trades. You won't be able to duplicate the re-sults in actual trading, but it makes comparing chart pattern performance easier. Figure 1 shows that. Of the 55 chart patterns with upward breakouts in a bull market, the best-performing pattern

Of the 55 chart patterns with upward breakouts in a bull market, the best-performing pattern is a bump-and-run reversal bottom. In the 2010s (the decade the rank is based on), the median rise was 47% (the median is a measure where half the samples perform better and half worse). That rise compares to a 47% gain during the 2000s and a 27% rise in the 1990s. The sample count ranged from 293 to 469, depending on the decade. If you average the performance of the 55 pattern types over each of the three decades, you get the results shown in the last line of the table. The best performance came during the 2000s. That decade had two bear markets (which are not included in the results) of about two years' duration, each. The other two decades did not have a bear market (so far, that is). The worst performance of chart patterns has come during the current decade with median gains of 22%. That's not much different from the 25% during the 1990s and it's not far below the 28% median during the 2000s. To put it less optimistically, if you traded chart patterns perfectly, you'd see a performance drop of 21% from what you achieved during the 2000s (that's the percentage drop from 28% to 22%).
BEARISH PATTERNS
Let's say you like to live on the wild side and short chart pat-terns.

BEARISH PATTERNS Figure 2 shows the median decline of the top-ranked chart patterns based on their performance during the 2010s. For downward breakouts, measure the drop from the breakout price to the ultimate low. The ultimate low is the lowest low before price climbed at least 20% or before it closed above the top of the chart pattern. The bump-and-run reversal top pattern shows the best performance during the 2010s with a median post-breakout decline of 15%. That's down slightly from the 1990s where the median drop was 17%. The last line shows the average of all 51 chart pattern types in the study. Patterns in the 1990s were the best-performing but performance has been flat over nearly two decades since then. In percentage terms, the median performance today is 27% below what it was in the 1990s. That sounds like a substantial amount, something you would notice if you traded chart patterns.
What happened to better-known patterns like triangles? Ascending triangles (rank 45), descending and symmetrical triangles (tied at rank 50) are near the bottom of the list of 55 patterns. Double bottoms? The best they rank is a mid-list 27. The high and tight flag, which is not nearly as popular as cup-with-handle but is still well known, ranks 40th. Of course, the popularity of a pattern is subjective, so don't draw any firm conclusions from this analysis. Some of the patterns listed in the table had not been found in the 1990s and yet they show good performance. The two figures in this article give you some idea of how chart patterns have performed over time. You can use the results to help gauge your trading results. Maybe trading has become more difficult. Maybe your favorite setup will stop working, not because the markets have changed, but because everyone anticipates a signal happening. If you focus not on making money but on perfecting technique, you'll likely improve over time.
 Trader Milko Zashev
 Read more:


If you think, we can improve that section,
please comment. Your oppinion is imortant for us.

