

- Home
- >
- Stocks Daily Forecasts
- >
- It is a matter of stock, the bulls are still strong of the day

It is a matter of stock, the bulls are still strong of the day
Rating:

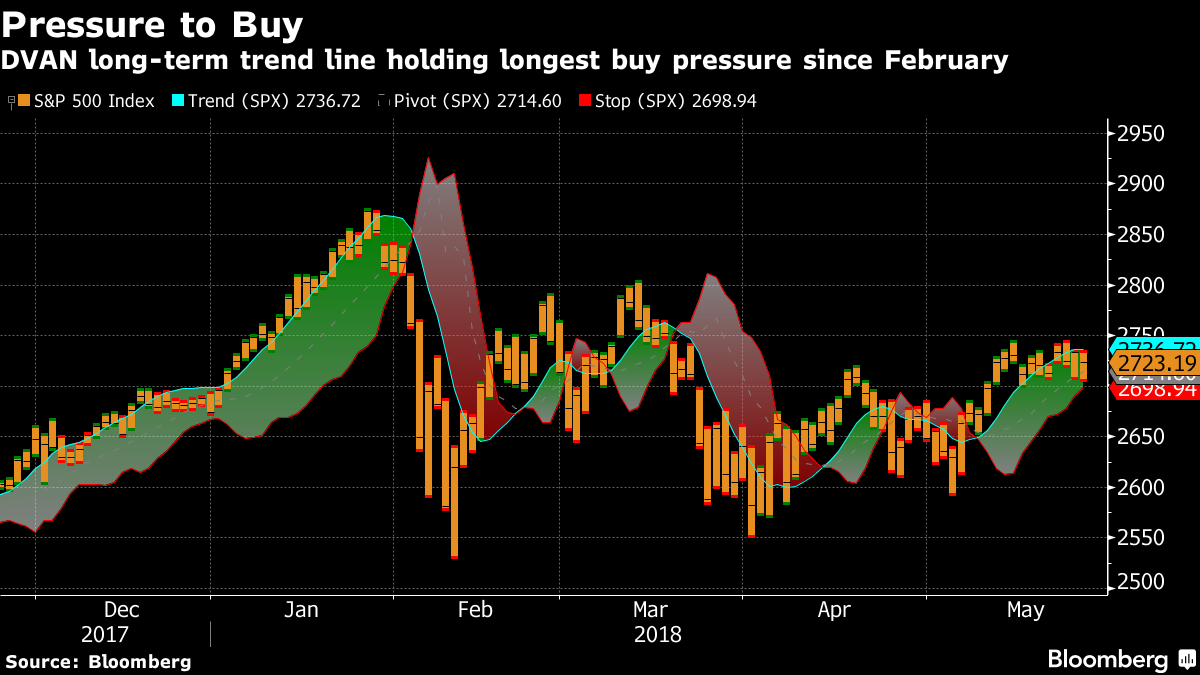
The equity bulls are still running, according to a technical gauge that measures the impetus to buy or sell stocks.
The index’s DVAN trend line -- a proprietary divergence analysis that measures buying or selling pressure is on its longest buying streak since the euphoric run-up that ended in February’s market tumble. Market pressure is measured by the overall range of divergence between the benchmark’s trading level and the trend line.
Data show that the market in May has been holding to an overall bullish sentiment, characterized by the green band in the chart above. Compare that with the swath of red in February, when the S&P retreated almost 4 percent.
The S&P 500 has gained 3 percent so far this month.
Source: Bloomberg Pro Terminal
 Trader Petar Milanov
 Read more:


If you think, we can improve that section,
please comment. Your oppinion is imortant for us.

