

- Home
- >
- Stocks Daily Forecasts
- >
- KCO.DE possibility for long positions (Kloeckner & Co SE)

KCO.DE possibility for long positions (Kloeckner & Co SE)
Rating:

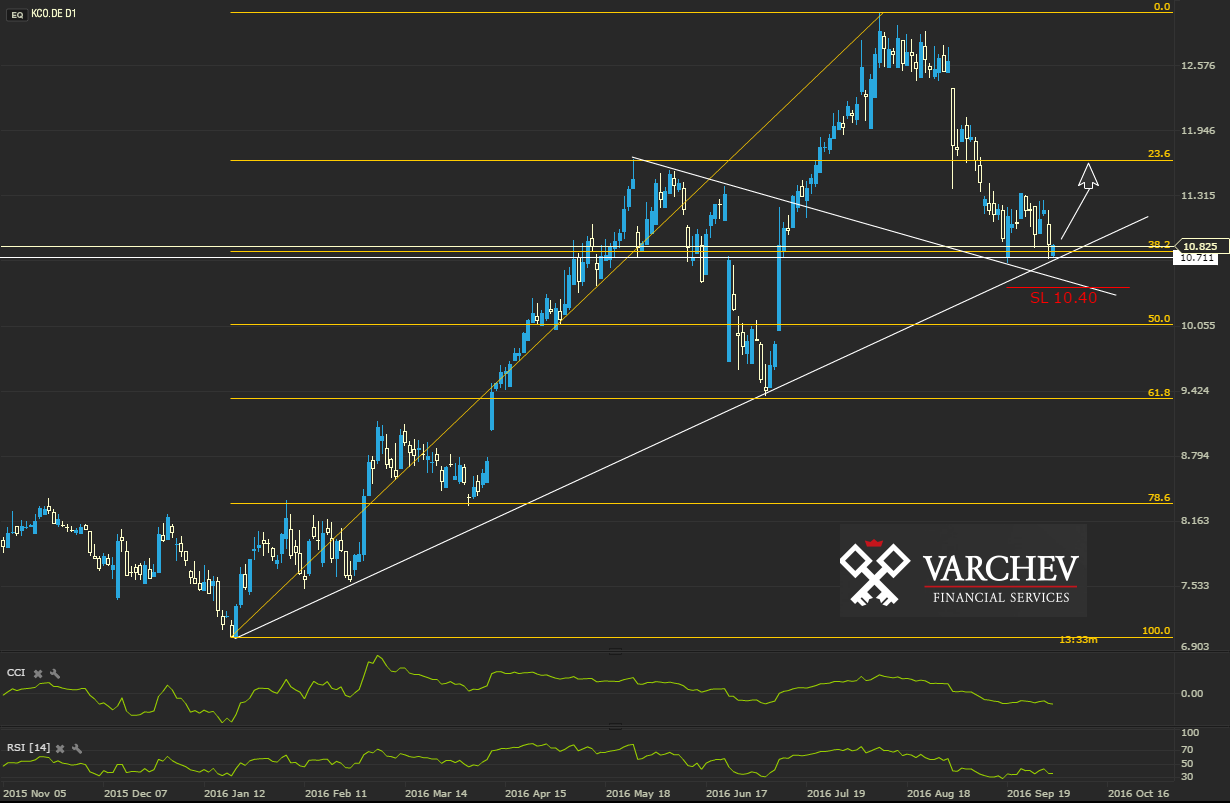
KCO.DE 04.10.2016 D1 chart.
Uptrend and correction to 38,2 Fibonacci.
Price on diagonal and horizontal supports.
Probable formation Double bottom to end the correction movement.
Technical indicators:
CCI(50) below 0 as going above 0 will confirm the upward movement likelihood
RSI(14) below50 as crossing above 50 can be used as confirming buy signal
SL 10.40
Alternative scenario: If price goes below supports this will negate the positive scenario.
Jr. Trader Nikolay Georgiev
 Varchev Traders
RECCOMEND
WAS THIS POST USEFUL FOR YOU?
If you think, we can improve that section,
please comment. Your oppinion is imortant for us.
If you think, we can improve that section,
please comment. Your oppinion is imortant for us.

