

- Home
- >
- Stocks Daily Forecasts
- >
- KRN.DE signal for long

KRN.DE signal for long
Rating:

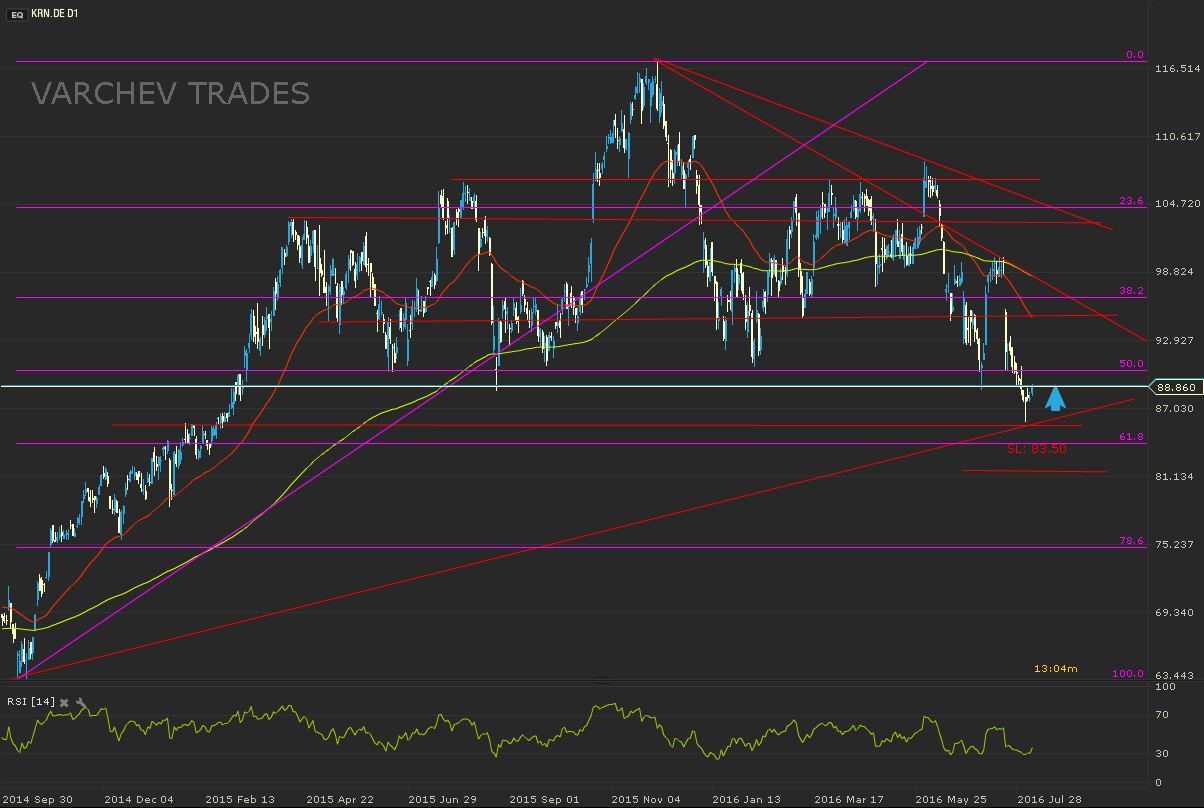
KRN.DE 08.08.2016
D1 chart
Upward trend, mid-term correction to levels of horizontal and diagonal support.
The share is performing better than the DAX index. The EPS (Earning per share) for the last 5 years are between 1.5% and 4.3%. Looking back 5 years, revenues of the company are increasing 6-8% yearly.
Price action signal - Pin bar at levels of horizontal and diagonal support
Technical indicators:
RSI(14) - Turns from the lower basis level- positive isgnal.
SL: 83.50
If the price goes below the bottom of the pin bar and Fibo 61.8, this will break the positive scenario.
Jr_Trader_B_Arabadzhiev
 Varchev Traders
 Read more:
 US – Iran – Iraq tension remain the main driver of the stock market today
 How top market players on Wall St think 2020 will look like on financial markets
 Money Flow before the start of the new trading week
 Cincinnati Financial Corporation (CINF.US) -Opportunity for long positions
 Asia stocks gain as Fed signals no rate cuts in 2020
RECCOMEND
WAS THIS POST USEFUL FOR YOU?
If you think, we can improve that section,
please comment. Your oppinion is imortant for us.
If you think, we can improve that section,
please comment. Your oppinion is imortant for us.

