

- Home
- >
- Trading University
- >
- Larry Willams: A lesson for reading charts

Larry Willams: A lesson for reading charts
Rating:

Here I will explain how to understand when the market falls or is in a rally.
The end of the cycle of downward trend can be seen clearly from your charts. Let me show you.
As you recall from the last lesson, we've learned that market peaks most of the time close around the highest values for the day, week, month, and so on. reverse dependence is also true and I will illustrate it in this lesson.
Market bottoms very often close at the lowest position for the day under the observed timeframe. And just like in the market peaks when we see it close low, we tend to have bearish attitudes. This is because the charts look bad, and we think this trend will continue. In fact, it is more likely not to be, and it will turn out to sell at the wrong time.
Let me show you what I'm talking about, pointing your attention to several charts.
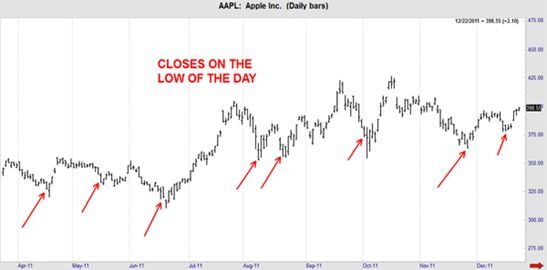
What you should observe are the days that close to the bottom and what position they occupy afterwards ... most of the time we are watching, especially if there are two or three bars in low positions ... rally.

Every rally we see (Apple Computer) starts when the closing price is at the lowest value of the day. This is the price cycle I am talking about.
In short, this is:
The price peak - when it closes at the highest level.
Price floor - When closing at the lowest level.
If you look insignificant, what you should notice up to now is that the price underneath closes close to the lowest level of the day. Then, when the market is in a rally, the low level begins to climb upwards until it eventually closes at or around the highest level of the day.
This is the cycle we were discussing. And his understanding is invaluable for traders.
Now let's look at an example with a commodity ... This time we will use crude oil. We can choose whatever it is, it does not matter. And it works in all markets.

Often a tool or commodity will start a rally on a significant move, the day after closing down. Typically, the low levels of foreclosure make many people sell the next day, and they sell to the professionals who wait, and when they start to buy, then the rally begins.
That's how the market works ... That's the way he always worked. The sooner you understand this natural cycle, the sooner you will be able to control your emotions by looking at the graphs and understanding what is actually happening.
Does this approach work on a weekly basis or on a daily basis? Just look at the graphs; here they are.


Now I'm sure you understand it. And I'm also so sure you have questions like; how exactly can we use this because sometimes we see low closing levels, and the market may continue to take down some more positions. They do not sneeze instantly.
And there is a solution to that. And I will introduce it to you in the next lesson. It will help you clearly see when it is most possible to have a rally or a downturn in the market.
Stay prepared and get the next lesson within a few days.
Larry Williams
 Trader Aleksandar Kumanov
 Read more:

If you think, we can improve that section,
please comment. Your oppinion is imortant for us.

