

- Home
- >
- Stocks Daily Forecasts
- >
- Market signals look long-term bullish

Market signals look long-term bullish
Rating:

With the market breaking out to all-time highs, the media has donned its party hat as headlines suggest clear sailing for investors ahead.
After all, why not? We have run one of the longest stretches in history without a 5%, much less a 10% decline. Threats of nuclear war, hurricanes, disaster, fires, earthquakes and civil unrest have failed to unnerve investors. It seems that all that has been missed as of late is famine and pestilence.
Nonetheless, the breakout is indeed bullish, and signals the continuation of the long-term bullish trend. However, that does not mean there are more than sufficient reasons to remain cautious. As noted on Tuesday, earnings growth remains weak outside of share buybacks, along with top line revenue. There is scant evidence of economic resurgence outside of a restocking cycle bounce, and inflationary pressures globally remain nascent. But such concerns, and I am not even sure the “4-horseman of the apocalypse” would make a difference, are “trumped,” by the ongoing global central bank interventions.

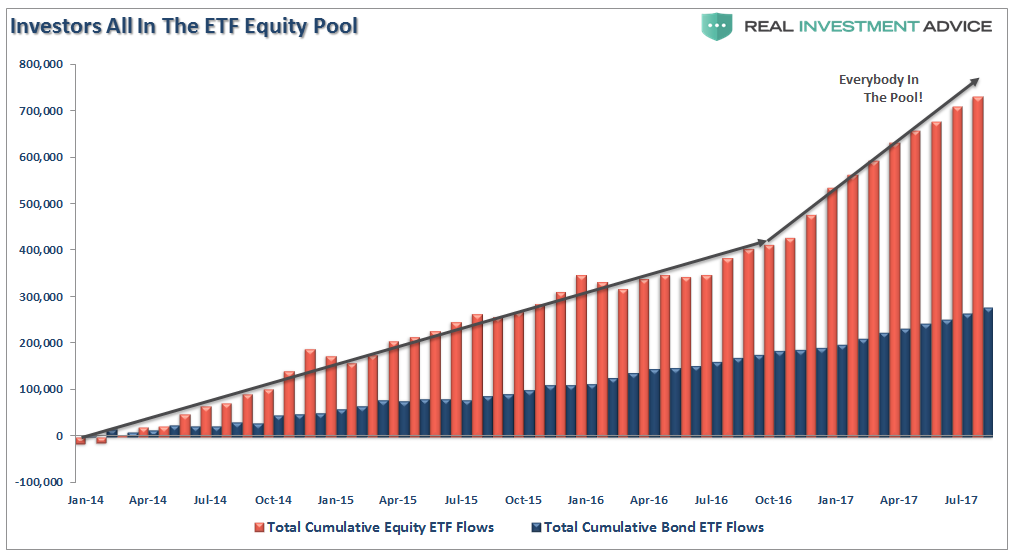
Not surprisingly, while it took individuals time to develop their “Pavlovian” response to the ringing of the “BTFD” bell, they have now fully complied as measured by the Investment Company Institute (ICI).

As shown in the chart above, as asset prices have escalated, so have individual appetites to chase risk. The herding into equity ETFs suggest that investors have simply thrown caution to the wind.
The same can be seen for the American Association of Individual Investors as shown below.

While the ICI chart above shows “net flows,” the AAII chart shows percentage allocated to stocks versus cash. With cash levels at the lowest level since 1997, and equity allocations near the highest levels since 1999 and 2007, it also suggests investors are now functionally “all in.”
With net exposure to equity risk by individuals at historically high levels, it suggests two things:
1. There is little buying left from individuals to push markets marginally higher, and;
2. The stock/cash ratio, shown below, is at levels normally coincident with more important market peaks.

The stock market has returned more than 60% since the 2007 peak, which is more than three times the growth in corporate sales growth and 30% more than GDP. The all-time highs in the stock market have been driven by the $4.5 trillion increase in the Fed’s balance sheet, hundreds of billions in stock buybacks, PE expansion and ZIRP.

The markets are indeed in a liquidity-driven up cycle currently. With margin debt near peaks, stock prices in a near vertical rise and “junk bond yields” near record lows, the bullish media continues to suggest there is no reason for concern.
Source: Bloomberg Pro Terminal
Jr Trader Alexander Kumanov
 Varchev Traders
 Read more:
 US – Iran – Iraq tension remain the main driver of the stock market today
 How top market players on Wall St think 2020 will look like on financial markets
 Money Flow before the start of the new trading week
 Cincinnati Financial Corporation (CINF.US) -Opportunity for long positions
 Asia stocks gain as Fed signals no rate cuts in 2020
If you think, we can improve that section,
please comment. Your oppinion is imortant for us.

