

- Home
- >
- FX Daily Forecasts
- >
- Morgan Stanley does not like the USD. What about the technicals?

Morgan Stanley does not like the USD. What about the technicals?
Rating:

Morgan Stanley believe, that the dollar would head lower. They cite some plausible reasons for their assessment, but as most people realize, what we think most times does not play out the way we think. That is especially true when we face things like China/US, Brexit, US/Europe, central banks, Pres. Trump, geopolitics, etc. There are a lot of things that go into the formula.
As a result, I like to also look at the price action and tools applied to that price action for clues that the story is playing out and the "market" (who move the price), is on board.
For example, "If the dollar is going down, is there overhead resistance that might stall the rise?" If that ceiling stalls the rise, the price can go down.
Another question might be "Is there a lower support level that if broken, would shift the bias more to the downside?" To go lower, the buyers need to change their mindset from buying to selling. Breaking key technical levels, does that.

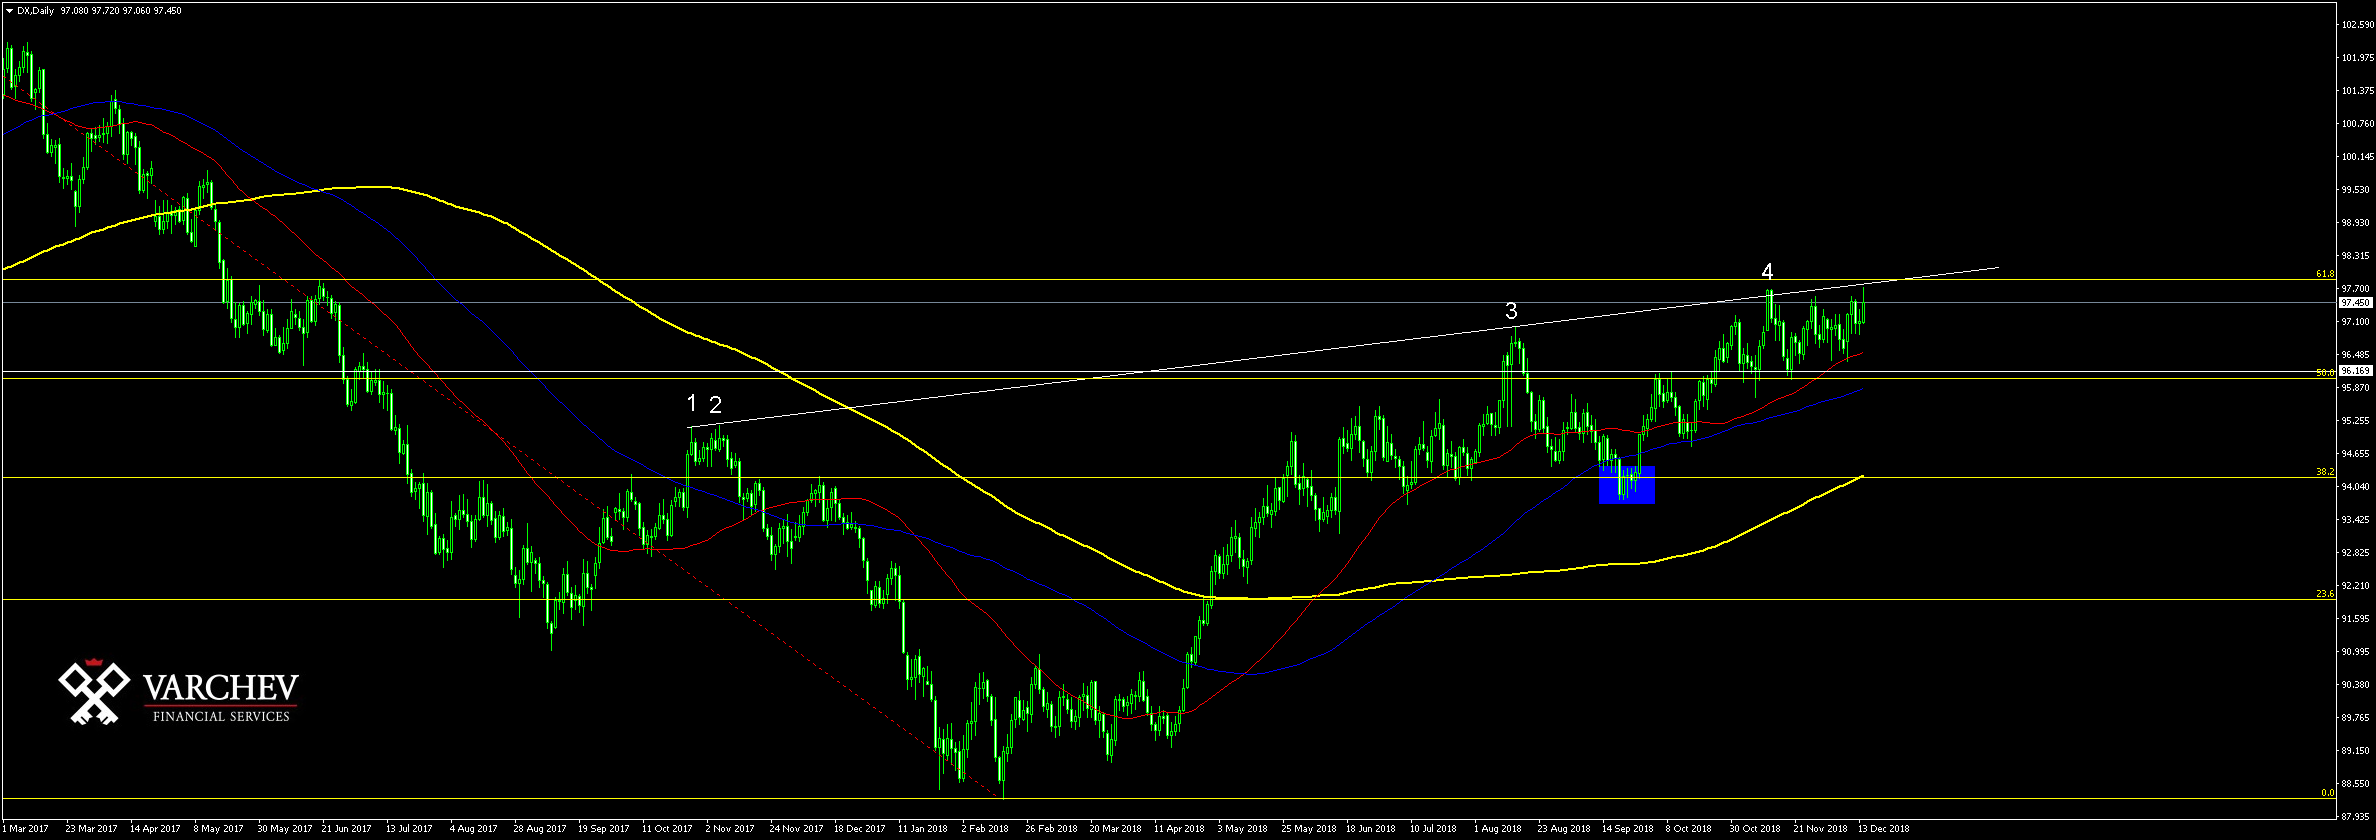
Looking at the daily chart above of the DXY (the weighted dollar index), shows that the index is approaching a resistance area at the 97.873 area.
The 61.8% retracement of the move down from the 2017 swing high comes in at that level.
The swing high from June 2017 stalled at that level
A topside trend line (see red numbered circles) come in near that level too
There is overhead resistance from multiple tools that could attract technical sellers. When multiple tools converge at an area, that are becomes a barometer for bulls and bear. Trade above it is bullish. Stay below and sellers are trying to take back control against the key resistance area. It may not lead to a big move lower, but it IS a start.
Right now, we are near a key level for the bulls and the bears.
That is off the daily chart.
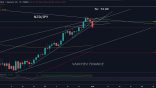
Drilling down to the hourly chart below, the high price today moved higher to test the swing high from November 12th. The high price today reached 97.71. The high from November 12th came in at 97.693.
Below the highs, there were some other swing highs from November 28th and December 11th. Those highs come in at 97.538. The price moved above those more recent swing highs today, but we are currently just below those levels. Sellers are taking more control.

So to answer the question,
"Is there overhead resistance that might stall the rise?"
The answer is YES on both the daily and the hourly charts. That is clear. If the price can stay below the 97.87 area that would keep the sellers in play for a reversal of the DXY (the USD).
The 2nd question is
"Is there a lower support level that if broken, would shift the bias more to the downside?"
Looking at the hourly chart first, the pair has been confined in an up and down trading range. More recently in December, the 96.379 was a double bottom (lows from Dec 4 and Dec 10). The highs at 97.69 and then 97.54 (see red and green numbered circles) are the higher extremes.
In between those levels are the 100 and 200 hour MAs. The price lows on Tuesday and Wednesday and Thursday this week found buyers near those MA line (the price dipped below but not my much). The 100 hour MA is now at 97.139. The 200 hour MA is at 96.998. Both are moving higher. If the price goes and stays below those MA, the bias would shift more to the downside.
Below that the 96.379 double bottom would be targeted. Again, get below and stay below is more bearish.
On the daily chart, the 50% midpoint of the range since the high in January 2017 comes in at 96.036. The 100 day MA is at 95.842. Moving below those levels would tip the bias for the dollar even more toward the bearish side. Remember, after a rally, the sellers need to wrestle control away from the buyers. They need to change the mindset from buy the dips to sell the rallies. Getting below targets on the downside, helps to do that.
So, downside targets - that if broken - would increase the bearishness of the USD include:
97.139 - rising 100 hour MA
96.998 - rising 200 hour MA
96.038 - 50% of the range since 2017
95.842 - 100 day MA
SUMMARY.
It is one thing to say you think this will happen because of this that or the other, but "the market" needs to agree and the crystal ball also needs to be right for it to play out like you (or Morgan Stanley) believes.
As a result, it is also important to plan out the road map for that idea. The price action and technical tools, help to give you the feedback you need to bring home the profits and complete the story.
 Trader Aleksandar Kumanov
 Read more:

If you think, we can improve that section,
please comment. Your oppinion is imortant for us.

