

- Home
- >
- Stocks Daily Forecasts
- >
- NDX: Long trend continues. Three higher bottoms and a breakthrough at diagonal resistance

NDX: Long trend continues. Three higher bottoms and a breakthrough at diagonal resistance
Rating:

NDX:
Date: October 21, 2016
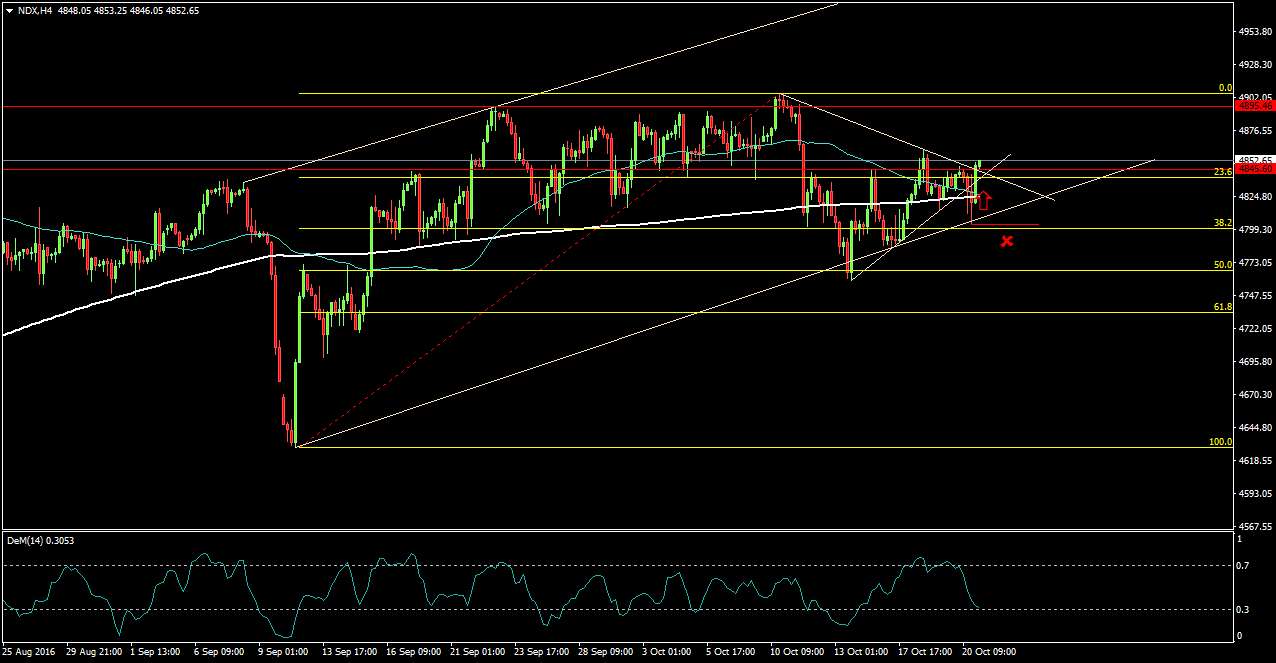
H4 Chart: Long trend
Price of the index has made 3 hihger bottoms after correction. It holds above diagonal support and 505 Fibo. Price again goes up and is breaking trough the diagonal resistance. It also trades above the horizontal resistance above 4845.00. Price has stopped falling at around 200 EMA
Price Action: Engulfing bar at strong support levels - signal for long

Alternative scenario: If the price goes down and breakthrough below it's previous bottom and the diagonal support, this may break the bearish scenario.
Technical indicators:
DEM (14): Close to oversold area
Entry price for long around: 4.850
SL: 4,800
Jr. Trader - S.Fuchedzhiev
 Varchev Traders
 Read more:


RECCOMEND
WAS THIS POST USEFUL FOR YOU?
If you think, we can improve that section,
please comment. Your oppinion is imortant for us.
If you think, we can improve that section,
please comment. Your oppinion is imortant for us.

