

- Home
- >
- FX Daily Forecasts
- >
- NZD/CAD: Good current levels for a new short position

NZD/CAD: Good current levels for a new short position
Rating:

NZD/CAD:
Date: July 28, 2016
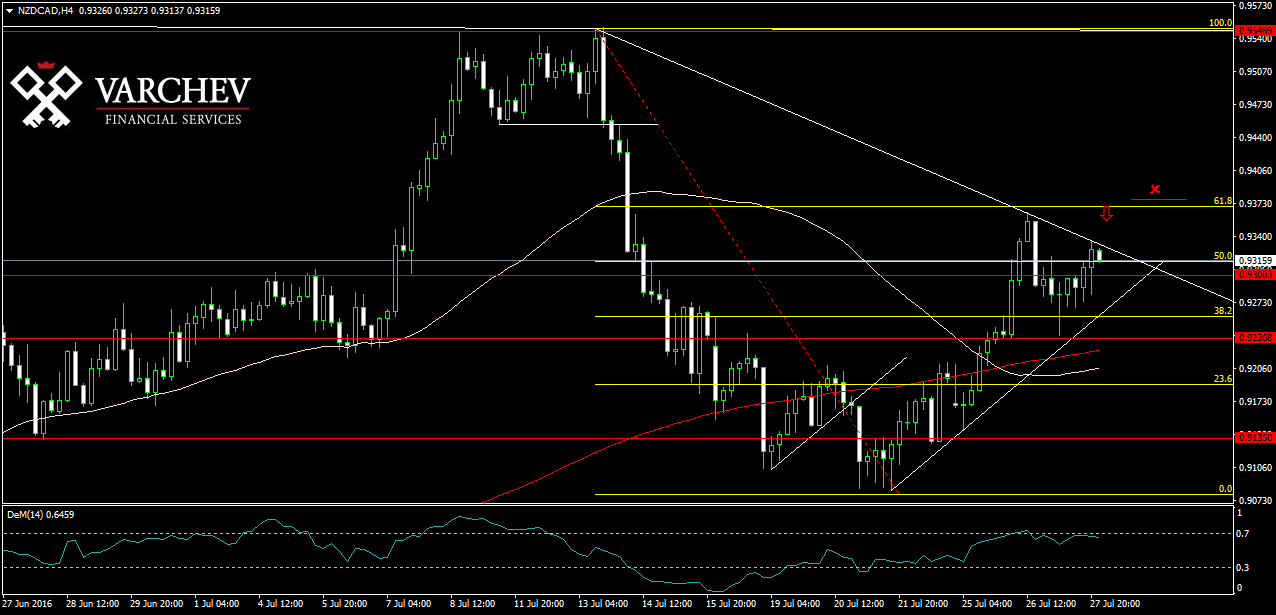
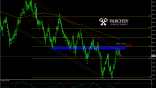
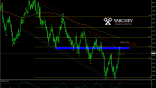
H4 Graph: Short Trend
The price moved lower after the triple top and found a bottom. After a correction up, the price reached 0,936500 and FIB 61,8% and again started going down. Now the price retraced forming a lower high and its below a diagonal resistance. We also have a horizontal resistance at 0,93000. МА's are crossed and bearish formation of 50 below 200 МА.

Alternative scenario: If the price continue up and moves up above the FIB 61,8% and above the diagonal resistance, this will cancel the bearish view.
Technical Indicator:
DEM(14) - Close to the overbought zone and turned down for short
Price for Entry short around: 0,93200
SL: 0.93800
Jr. Trader - S. Fuchedzhiev
 Varchev Traders
 Read more:
RECCOMEND
WAS THIS POST USEFUL FOR YOU?
If you think, we can improve that section,
please comment. Your oppinion is imortant for us.
If you think, we can improve that section,
please comment. Your oppinion is imortant for us.

